Sector Extensions
Markets are currently in turmoil and it’s a good opportunity to look for some over extensions in either direction. It’s well known that things usually revert to the mean and for the past few weeks’ things have been nothing but average. Volatility is up and overall indexes are down. Let’s quantitatively analyze an overall gauge of how the sectors are doing and then dive in that sector to see if there are some possible plays to be made. Reversion to the mean makes me think about a moving average. Moving averages (MA’s) are nice smooth lines which take historical pricing of a given ticker into account. We’ll look at the two most common MA’s of length being 50 days and 200 days. Using a unique universe of symbols we’ll be searching for how each stock is currently trading at with respect to its 50 and 200 day MA. The universe of stocks taken into account holds about 3800 symbols. We’ll import the needed libraries and pull the ticker information from a personal MySQL db. This is a personal setup of company tickers, you may do the same thing with our previous sp500 csv.
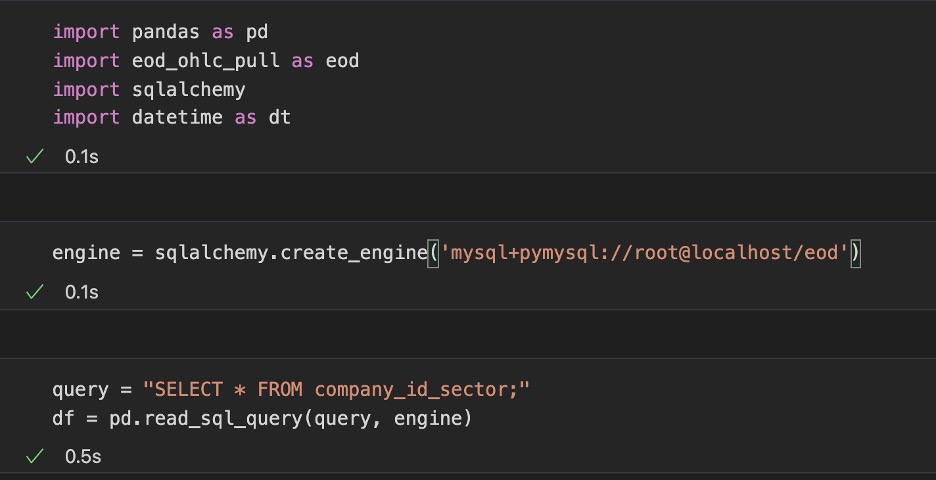
Then we’re going to create some columns which we will populate as we go forward. The columns we want are “adjusted_close”, “50_MA”, “200_MA”, “50_pct_from”, “200_pct_from”. For each ticker we want to know what is the most recent 50 and 200-day MA, we will then use those values in comparing how far the most recent adjusted close price of that ticker is from those moving averages.
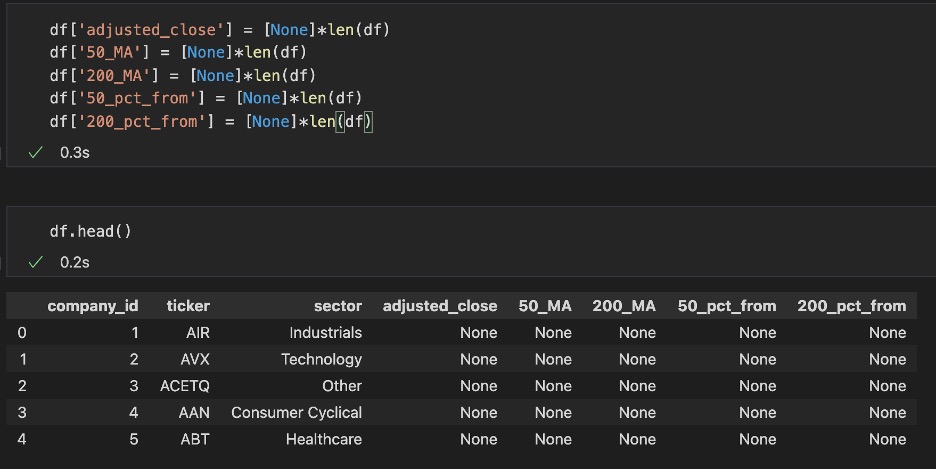
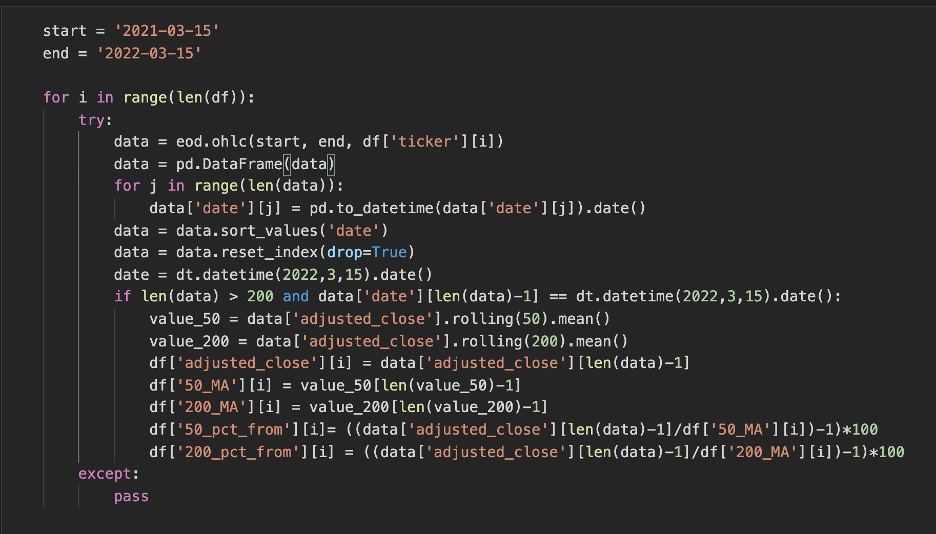
Above shows us what our data frame is going to start with. We got the ticker, its associated sector and to the right is the data we will be populating. I’ve kept these as python None rather than zeros as it will be easy to drop tickers that are not supported by our data source API (End of Day Historical). The code below populates the data that we need. Some important things are to change the dates into datetimes as we’ll need to compare certain datasets with dates rather than strings. The code below goes through all of the tickers and populates it with what we are looking for.
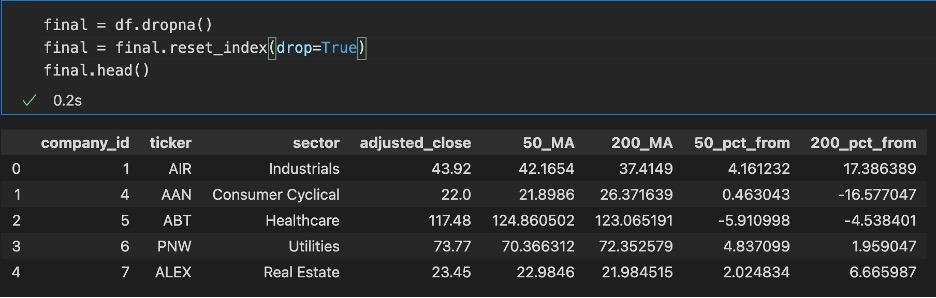
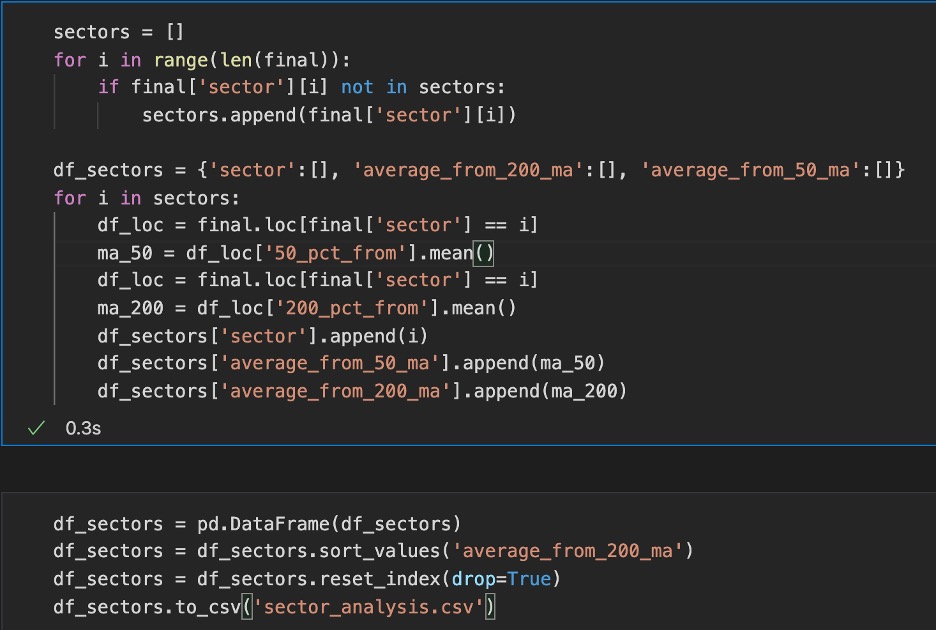
After dropping the tickers not supported by the API, we get something that looks like so above. We can write that to a csv for later use and move forward with getting a qualitative understanding of the data we just created. Now that we have the information we need for a large amount of tickers we can sift through it to begin with a qualitative approach. Let’s divide everything into its associated sectors and find on average how that sector is doing with respect to its moving average. Below is the code that does that and we write the output to a csv we will evaluate graphically.
Once we have that as a csv we can go ahead and use JMP to create a heatmap to show us how the sectors are doing. Below is a qualitative look at sectors average percentage from 200-day MA.
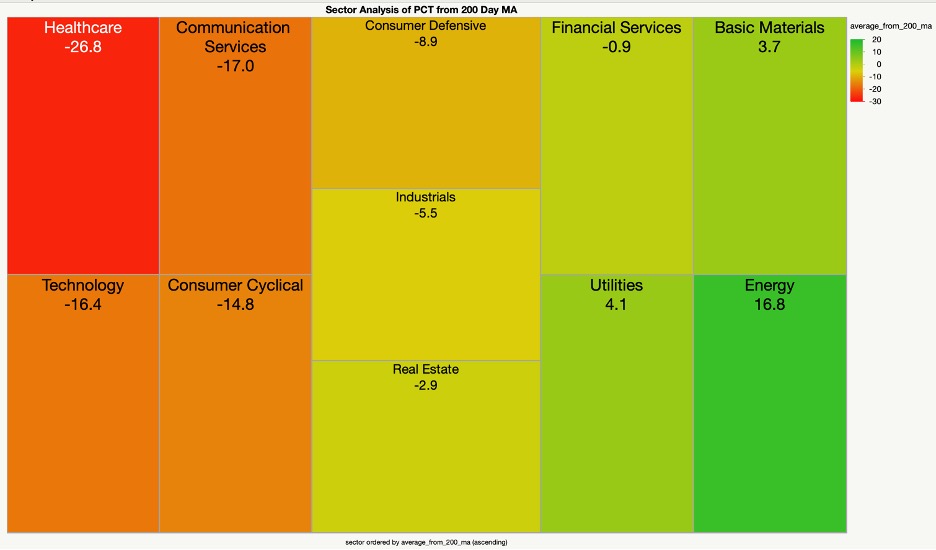
The values above are an average of how stocks within that sector are performing from their 200-day MA. Only 3 out of the 11 sectors are trading at above the 200-day MA with Energy leading the way. This makes sense as Energy stocks have continued to rally since 2021, and the price of oil has increased drastically. Money typically flows into Utilities when things get volatile, and that is certainly the case over the past few weeks. We can dive in deeper by looking at the most over extended sectors. For examples sake we’ll look at healthcare as it has taken the largest hit. We can make sense of this because while that sector has some large staples it also houses a large amount of small cap speculative stocks. When things get volatile speculative assets tend to bleed. The graph above does a good job describing money flow from sectors filled with speculative growth (healthcare, technology) to safer assets (utilities, energy).
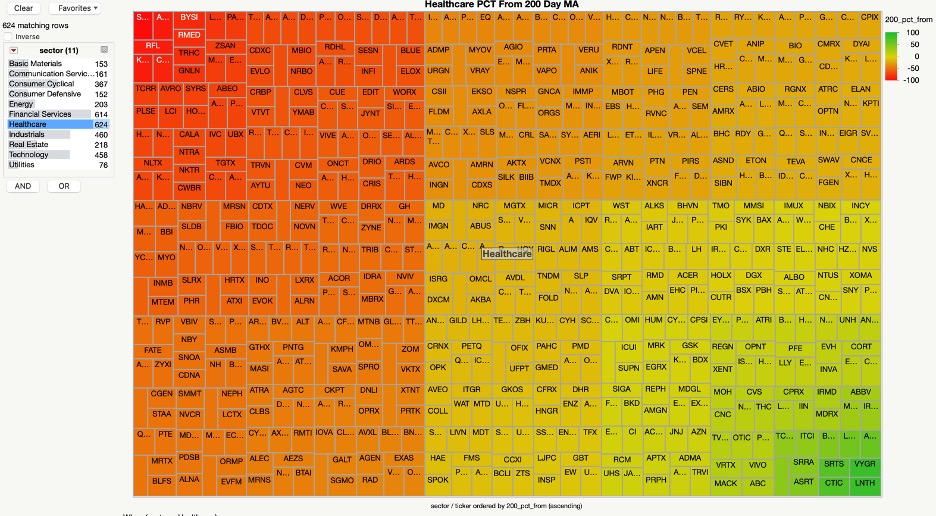
We dive into healthcare and see that it’s not doing too well. So, if you believe that this current market turmoil is temporary and that stocks typically revert to the mean this may be a sector that you would make a play in. This is also based on a personal universe of stocks so please do your own research with your dataset in making any financial decisions.
Code
import pandas as pd
import eod_ohlc_pull as eod
import sqlalchemy
import datetime as dt

engine = sqlalchemy.create_engine('mysql+pymysql://root@localhost/eod')
query = "SELECT * FROM company_id_sector;"
df = pd.read_sql_query(query, engine)

df['adjusted_close'] = [None]*len(df)
df['50_MA'] = [None]*len(df)
df['200_MA'] = [None]*len(df)
df['50_pct_from'] = [None]*len(df)
df['200_pct_from'] = [None]*len(df)

start = '2021-03-15'
end = '2022-03-15'

for i in range(len(df)):
    try:
        data = eod.ohlc(start, end, df['ticker'][i])
        data = pd.DataFrame(data)
        for j in range(len(data)):
            data['date'][j] = pd.to_datetime(data['date'][j]).date()
        data = data.sort_values('date')
        data = data.reset_index(drop=True)
        date = dt.datetime(2022,3,15).date()
        if len(data) > 200 and data['date'][len(data)-1] == dt.datetime(2022,3,15).date():
            value_50 = data['adjusted_close'].rolling(50).mean()
            value_200 = data['adjusted_close'].rolling(200).mean()
            df['adjusted_close'][i] = data['adjusted_close'][len(data)-1]
            df['50_MA'][i] = value_50[len(value_50)-1]
            df['200_MA'][i] = value_200[len(value_200)-1]
            df['50_pct_from'][i]= ((data['adjusted_close'][len(data)-1]/df['50_MA'][i])-1)*100
            df['200_pct_from'][i] = ((data['adjusted_close'][len(data)-1]/df['200_MA'][i])-1)*100
    except:
        pass

final = df.dropna()
final = final.reset_index(drop=True)
final.to_csv('output_results.csv')

sectors = []
for i in range(len(final)):
    if final['sector'][i] not in sectors:
        sectors.append(final['sector'][i])

sectors = []
for i in range(len(final)):
	if final['sector'][i] not in sectors:
		sectors.append(final['sector'][i])

df_sectors = {'sector':[], 'average_from_200_ma':[], 'average_from_50_ma':[]}
for i in sectors:
	df_loc = final.loc[final['sector'] == i]
	ma_50 = df_loc['50_pct_from'].mean()
	df_loc = final.loc[final['sector'] == i]
	ma_200 = df_loc['200_pct_from'].mean()
	df_sectors['sector'].append(i)
	df_sectors['average_from_50_ma'].append(ma_50)
	df_sectors['average_from_200_ma'].append(ma_200)

df_sectors = pd.DataFrame(df_sectors)
df_sectors = df_sectors.sort_values('average_from_200_ma')
df_sectors = df_sectors.reset_index(drop=True)
df_sectors.to_csv('sector_analysis.csv')