More Smirk Than Smile
The Black-Scholes model can be used to theoretically price an options contract. Given the parameters of the price of an underlying asset, strike price, time to maturity, risk-free interest rate, and implied volatility the theoretical price of an option contract can be attained. All these parameters seem to be attainable to calculate the price of a contract, but it is not. The missing parameter being implied volatility. Historical volatility and implied volatility are not the same. Historical volatility is calculated using the assets previous price movement. Implied volatility is back calculated and shows what the market believes the volatility will be in the future. This goes against the black-scholes method assumption that volatility is constant when looking at one asset. Pricing models for stocks have fat tail distributions meaning that the unlikely price movements are more likely to happen than a typical normal distribution. This causes the pricing of deeper ITM and OTM contracts to be sold with higher IV priced in when compared to ATM contracts. Knowing this we can expect to see a curve that looks like a smile. However, It looks more like a smirk and we will experimentally show that.
We are going to look at the SPY ETF as it is heavily traded and can be seen as a nice gauge to look at overall feel of the market for the future. The ticker we will be looking at is the SPY exchange traded fund. I think this is a good ticker to look at as it is heavily traded, and it can potentially give us a gauge of confidence in the overall market in the future. What we’ll do is gather real minute options data from TD Ameritrade for SPY contracts. Below will be a quick script in gathering that data and inserting it into your own MySQL database. We’ll let the script run for five days and analyze that data.
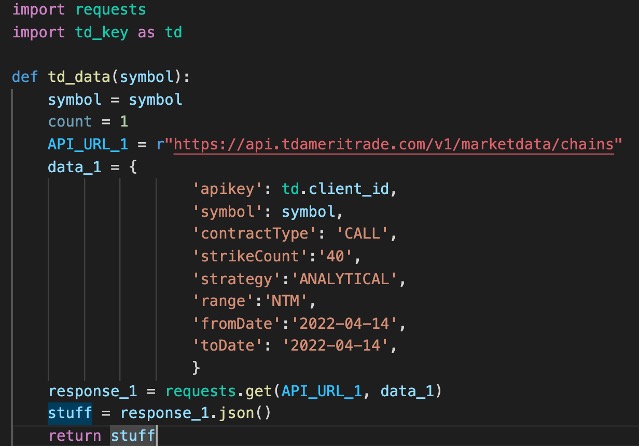

There are two scripts above. The first is communicating with TD Ameritrade API to get the data we want, which are the Call SPY contracts expiring on 4/14/2022. Since the SPY ATM contract changes over time the contracts we will be looking at will always be 20 ITM and 20 OTM providing a window that follows the ATM contract. Looking back, I would have liked to track a fixed percentage rather than strike from the ATM contract, but we’ll make do with what we have.
Now that the option pricing data is available, we will calculate the implied volatility. Below is the Black-Scholes pricing model for a call option.
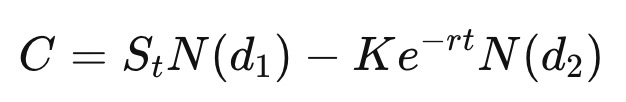
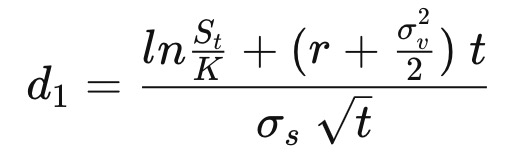
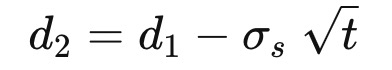
C = Call option price
S = Underlying asset price
K = Strike price
t = Time to maturity
r = Risk free interest rate
sigma = Implied volatility
N(x) = Normal distribution cumulative density function
What we are after is sigma as the other parameters are already known. A simple method we’ll be using to solve for sigma is plugging in values until we find one which equates to a tolerable call price. Guess and check through multiple iterations.
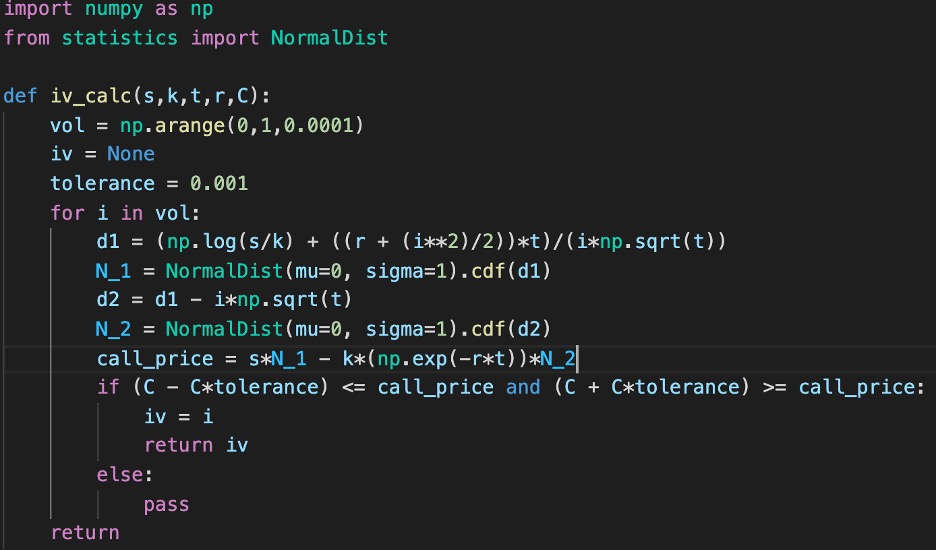
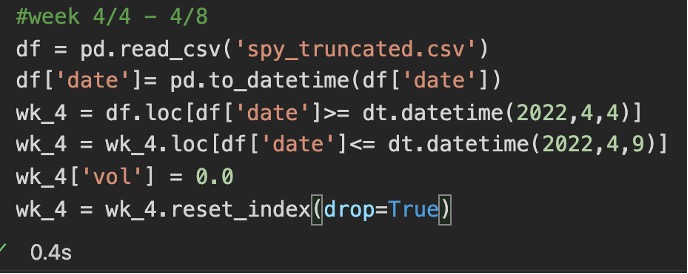
The above script will be utilized to calculate implied volatility given underlying asset price (s), strike (k), time to maturity (t), risk-free interest rate (r), and price of the Call option (C). First, we need to get our data from our MySQL database and into a pandas dataframe.
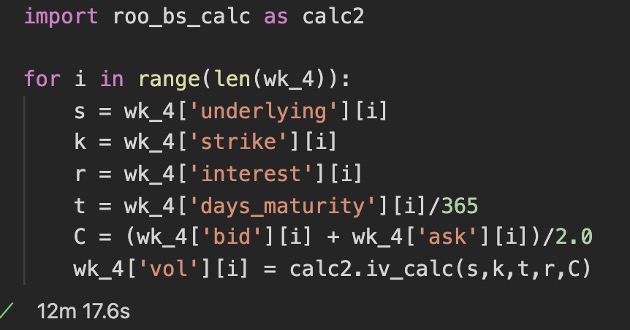
We’ll then use the iv_calc script to iterate through each contract and calculate the iv like below.
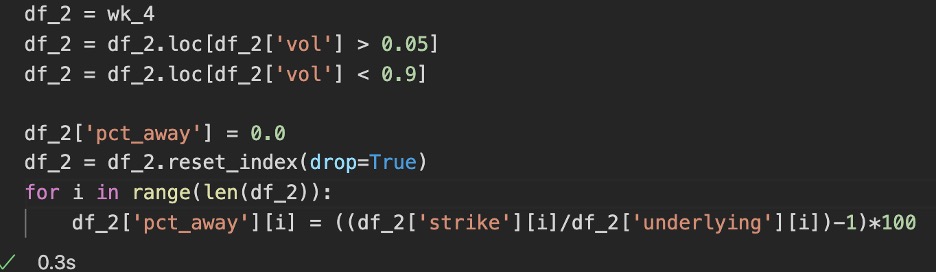
We are then going to filter out any iv outliers which usually occur with unrealistic ask/bid spreads and create a column for “pct_away” from the underlying asset price. The below code shows what we want.
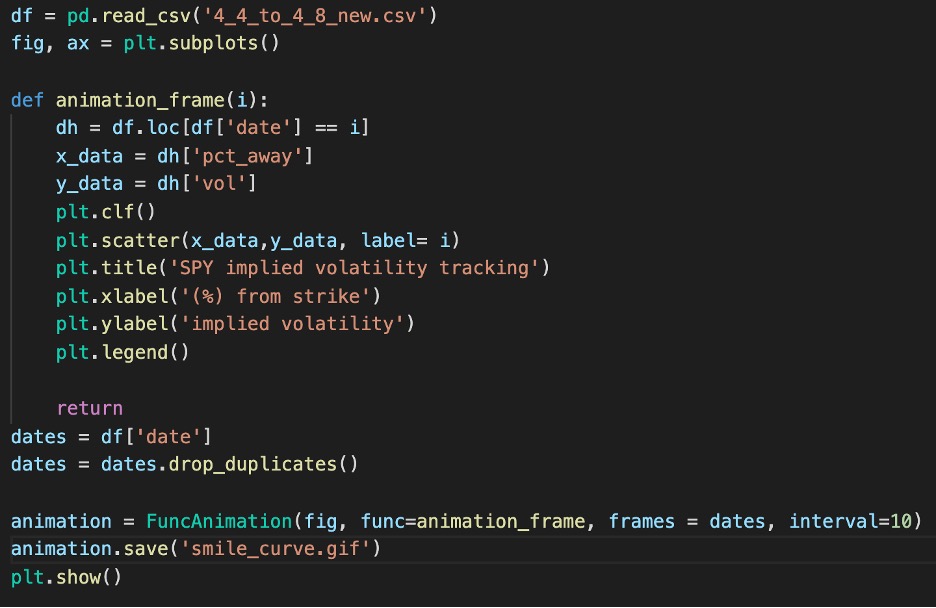
Once we have the iv values, we’ll save it to a csv and move onto creating an animation of our smile curve! Below is the code in creating an animation of SPY contracts implied volatility with respect to percentage from strike value.
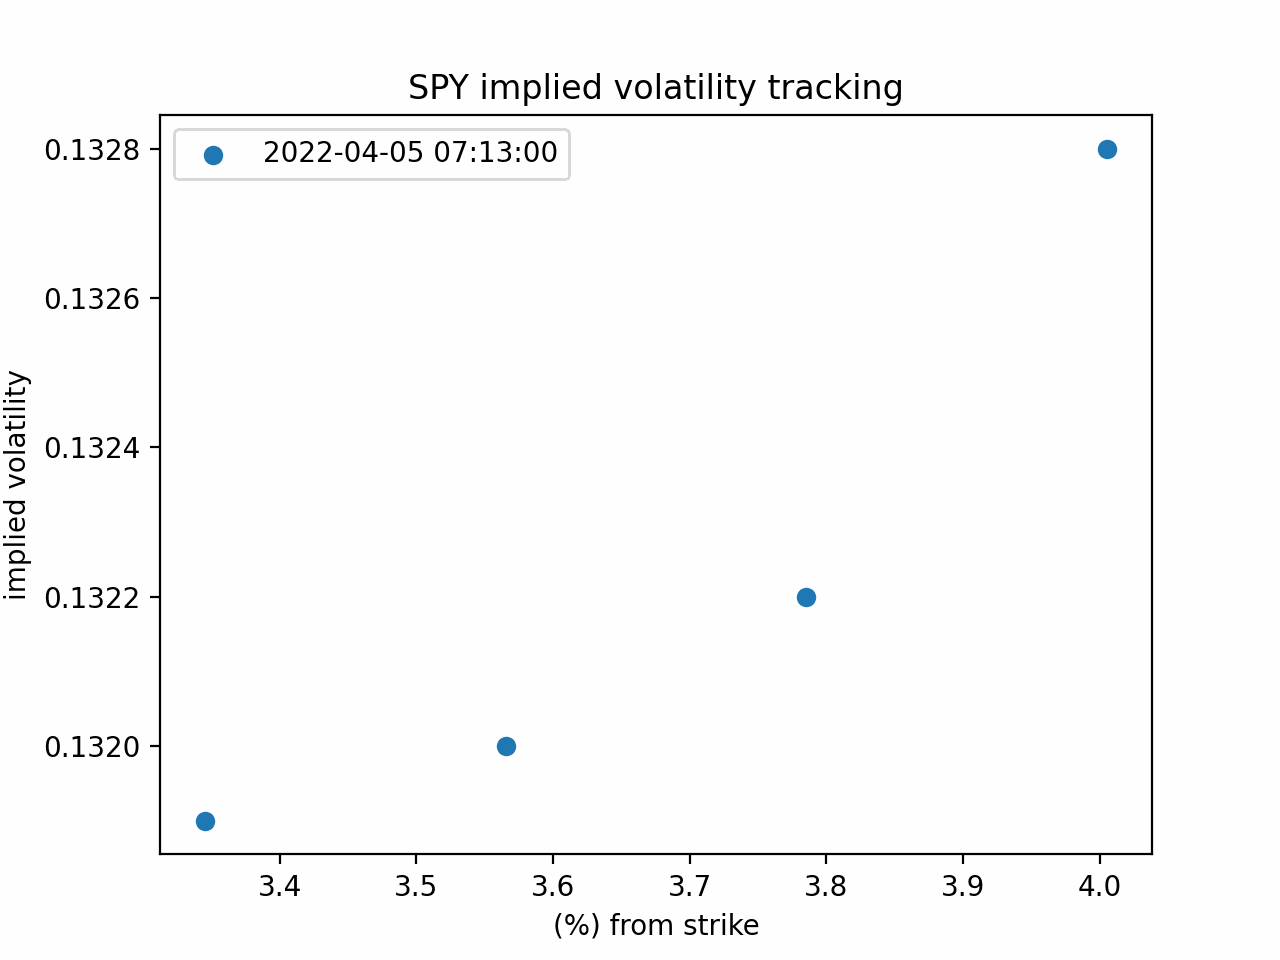
Above is the animation of what we wanted and we can see how the curve changes as time passes. It shows some interesting behavior as time passes. The most obvious being that the curve shifts up and down which is expected as certain days will be more volatile than others. More interesting is that the OTM strikes curve upward as time approaches our last day 4/8. This is something I would like to research further. A tool like this can be used as a reference. If our trading strategy is typically swing of about a month out, we can gather more data and create a reference curve of how contracts of SPY behave a month out. When we have enough data points we can compare current iv curves with historical and gauge weather contracts are trading at a premium or not. How the curve deviates from the historical curve can also imply investor confidence or fear. These are just ideas to dive into with more data gathering.