Financial Portfolio Simulation
Introduction
The purpose of this experiment was to create a research environment where you can search through parameters and see whether there is a relationship between that parameter and overall portfolio return. This experiment is based off a small sample size and it was created to fulfill curiosity and build a frame work for a research environment. The hypothetical question was that I wanted to construct a portfolio for the year, and my buy signals are dependent on 5 parameters. Out of these 5 parameters which ones are more important than the others? There’s no exact answer to this, but we can search for a qualitative understanding by running a monte carlo simulation of many constructed portfolios with different parameter weighting. Through a large enough amount of iterations we hope to find some relationship between parameter weighting and overall portfolio return. Backtesting year by year with random weighting of each parameter gives a unique portfolio return. When doing this over different years, we can search for a qualitative trend for a given parameter.Scope
First, let’s define some rules for our strategy. These rules are mainly based off my personal time at Haugen Equity Signals and a book called “The Little Book That Beats the Market” by Joel Greenblatt. The frequency of trades are based off Haugen as they sold signals to clients on a monthly basis, and the strategy is simillar to what is found in the book because it’s simple enough.Rules of the portfolio:
Rules of the strategy:
What are the 5 parameters?
What’s our database look like?
Running the Experiment
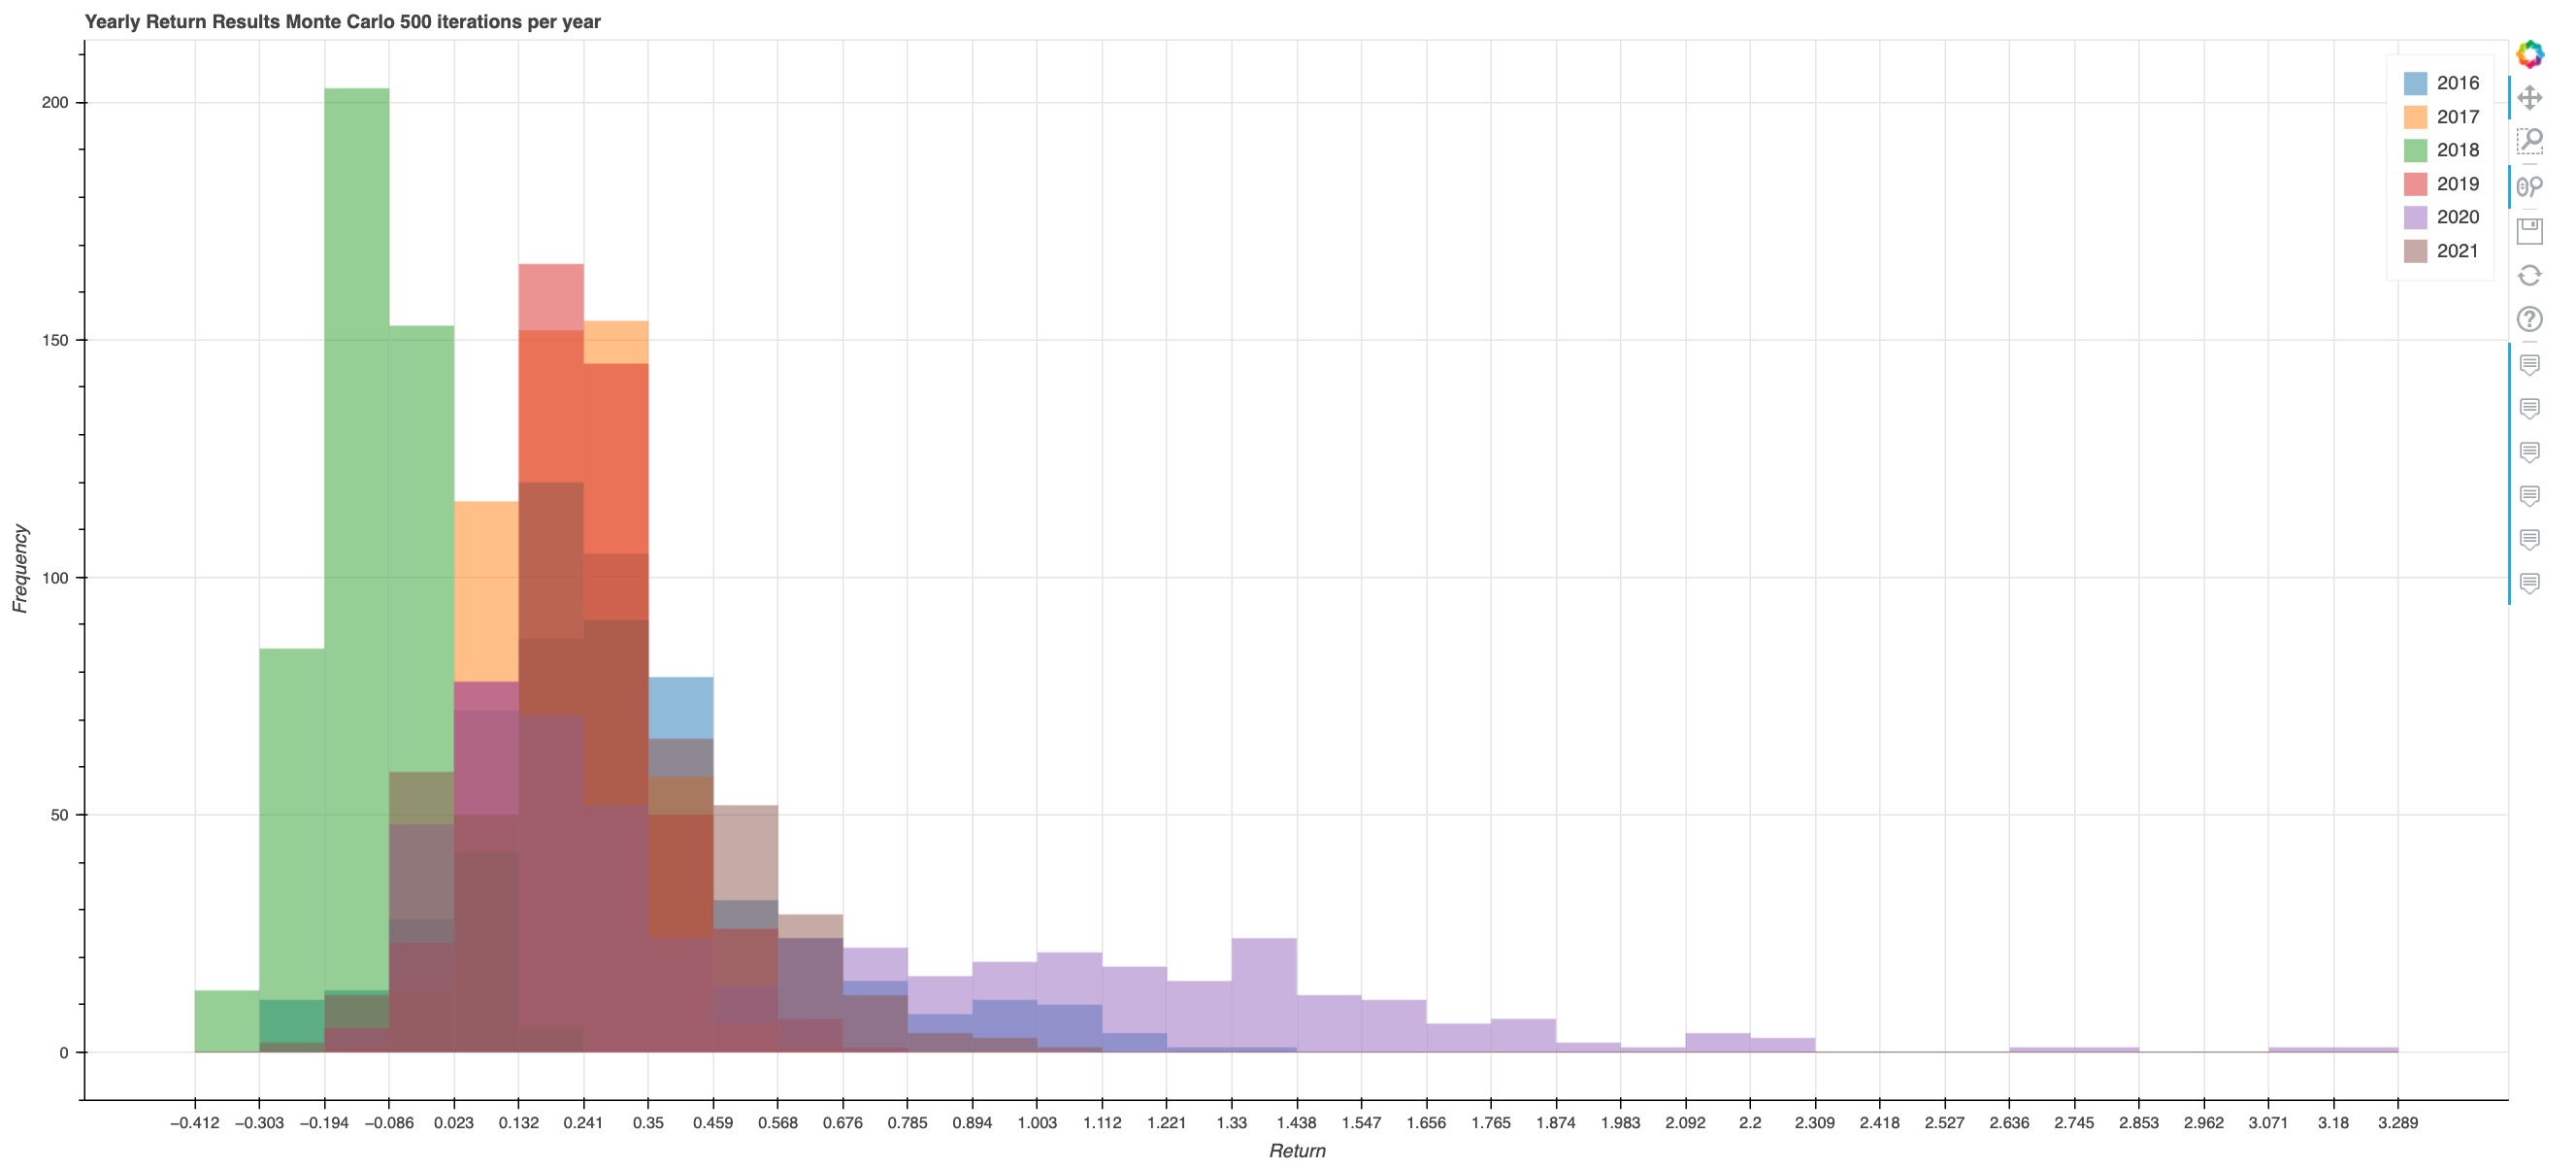
The years that we’ll be looking at are from 2016-2021. We’ll do 500 iterations for each year. Each iteration will contain unique weighting for its given parameter and its associated portfolio return.Example of the flow for 1 iteration over 1 year:
Results
At the end, the results are documented using Pythons Bokeh data visualization library. Click below for the interactive data for all the years. The legends toggle so you can begin by deselecting all parameters and then toggle one by one to search for a trend.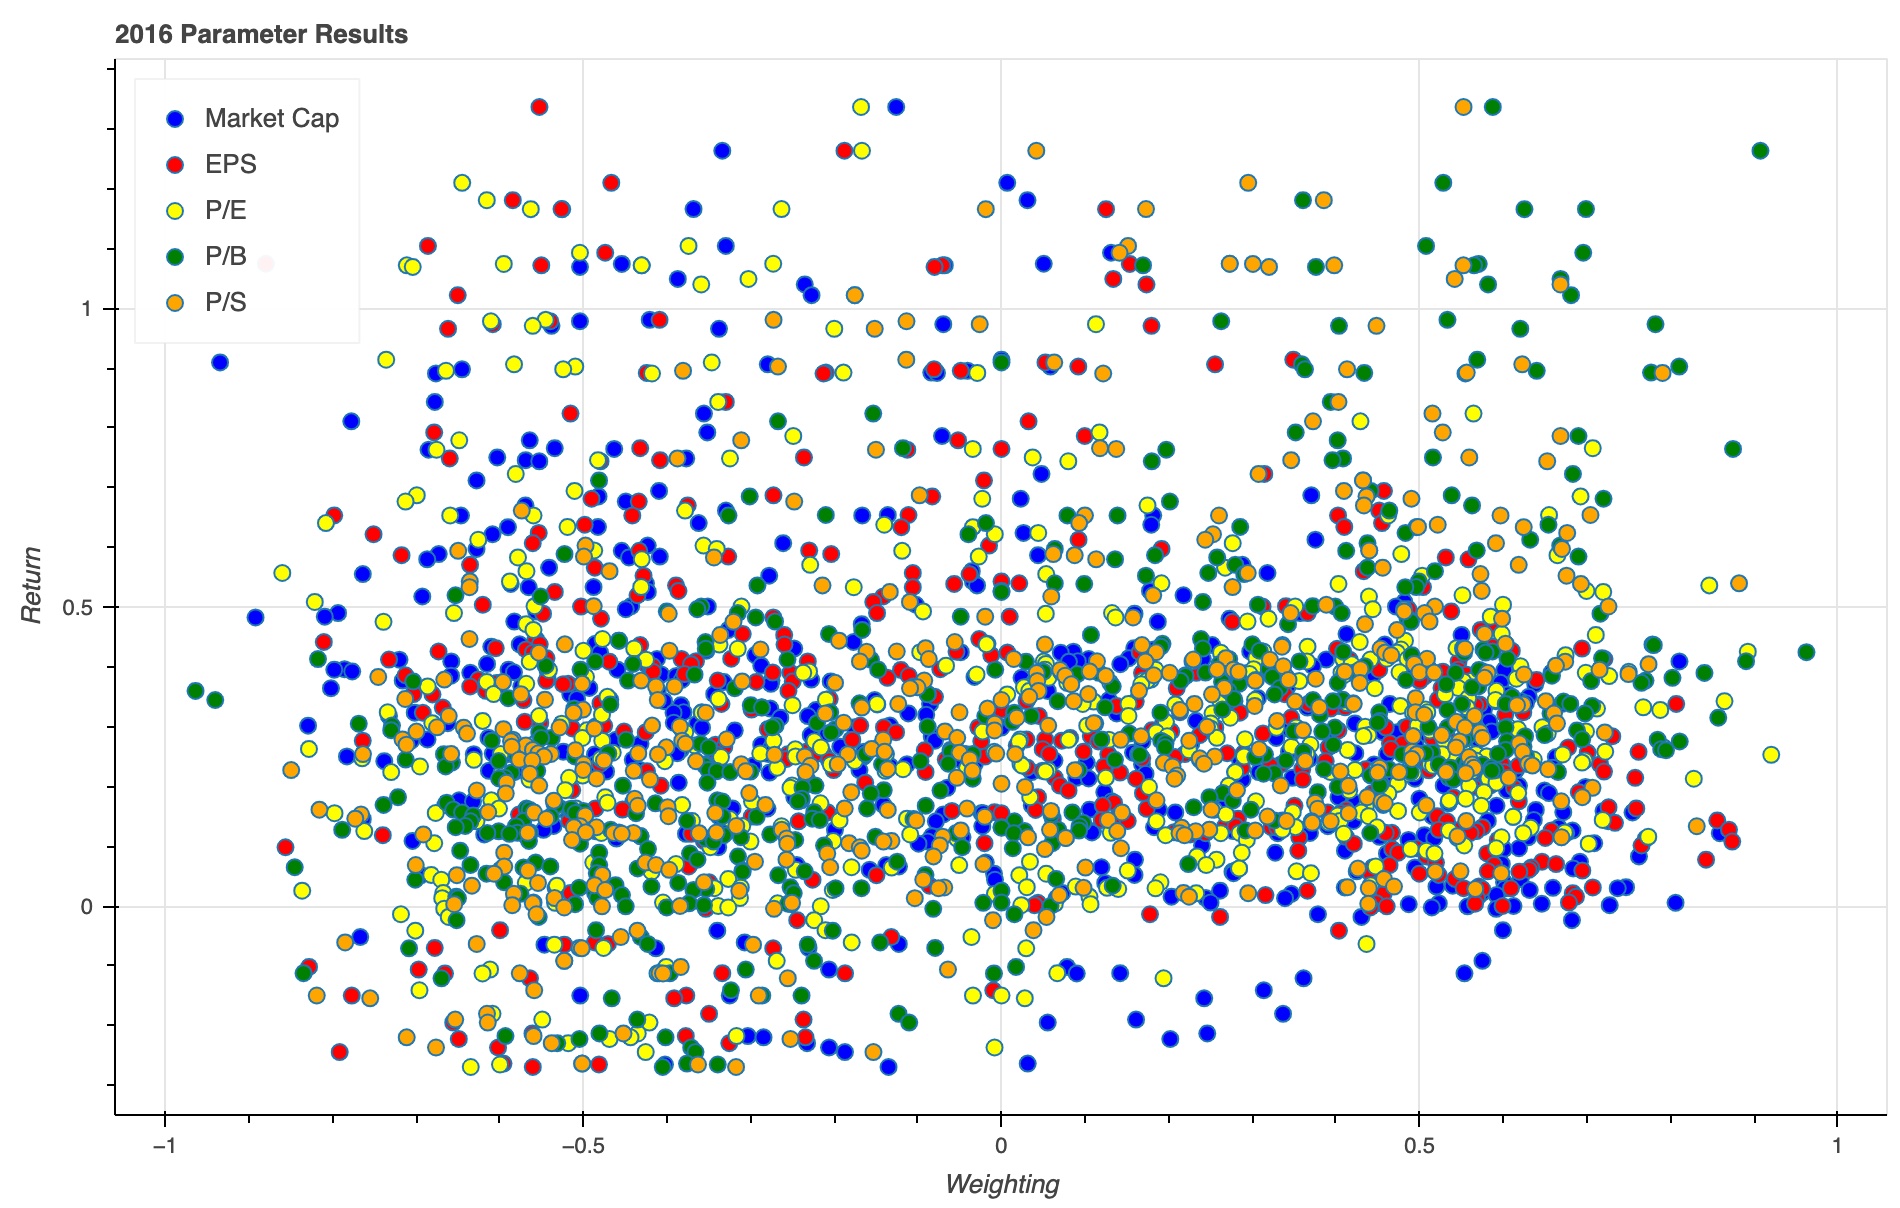
Going through the results there’s no smoking gun and that is expected as we are looking at only 5 parameters with 500 iterations per year, which is quite a small sample size. The purpose of this project was to build the framework in which research can be conducted when constructing a strategy through quantitative evidence.