Hedge
Finder
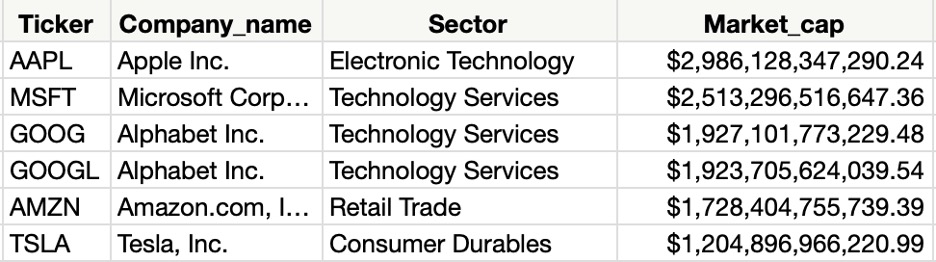
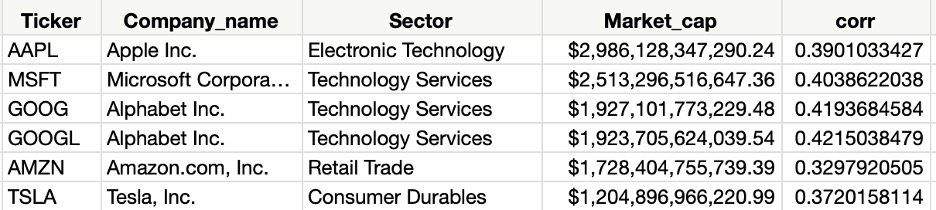
Say you’re investing strategy is on the longer side and you have your picks made for the year. There are 3 outcomes your portfolio will be at when t = 365 right? It can increase, decrease, or stay the same. Of course, beating the market is difficult and timing your plays are even harder, so we want to allocate some funds towards a few positions which go against what we believe will happen. This is hedging in a simple explanation, it’s getting into positions that softens the blow to your portfolio if things don’t go as planned. Yes, there is a trade of risk and reward. Just like insurance you’re utilizing your dollars for some safety rather than risking those dollars to potentially make even more money. So how do we find hedges for our ideas? Quantitatively it’s about correlation of price movement. With respect to your stock how does the other stocks in the market move? A correlation of 1 means they move together, -1 meaning they move opposingly, and 0 meaning there is no relationship of price movement between the two stocks. Let’s build a tool that takes an input ticker and spits out correlation values with respect to that input ticker. We’ll stick with the S&P 500 for simplicities sake. We’ll use a provided for csv of the S&P 500 that looks a like below
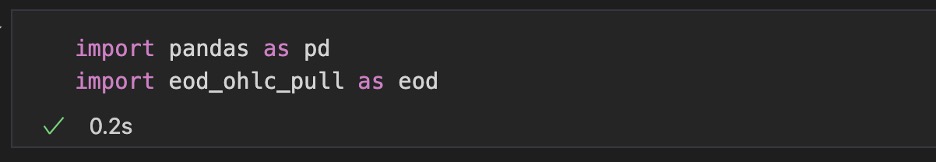
Then import the needed libraries. “eod_ohlc_pull” is a personally made library for communicating with EOD Historical Data API, which is where I get my pricing data. That file will be available on GitHub. Other than that all we’ll be using is pandas.
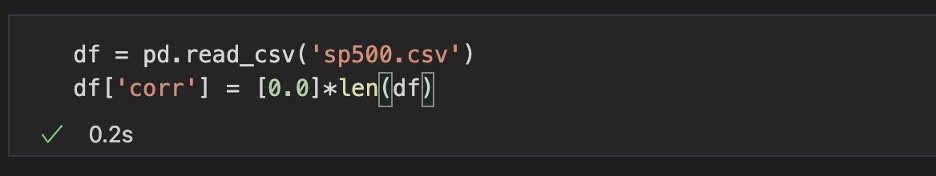
Next, we’re going to upload the sp500 csv into a panda’s data frame, and create a new column called “corr” which will keep track of the correlation coefficient with respect to a specific ticker.
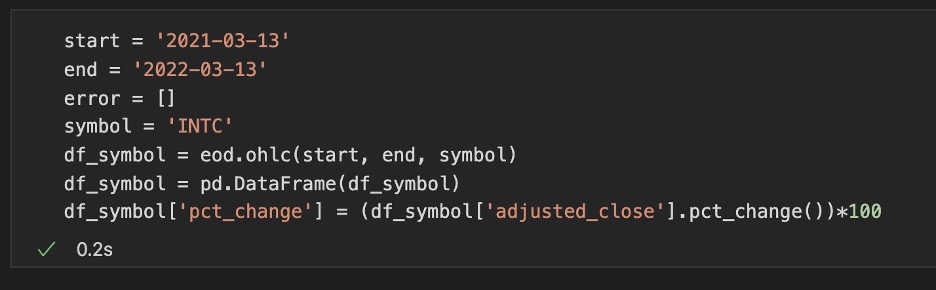
We’re then going to define a period of time of the pricing data we want, pick our stock (in this case it is INTC), pull that data from that period, and finally create a column of “pct_change” from adjusted close. When we compare our stock INTC to the rest of the S&P we want the correlation coefficient to be in regard to the daily change in price, which is our “pct_change” column.
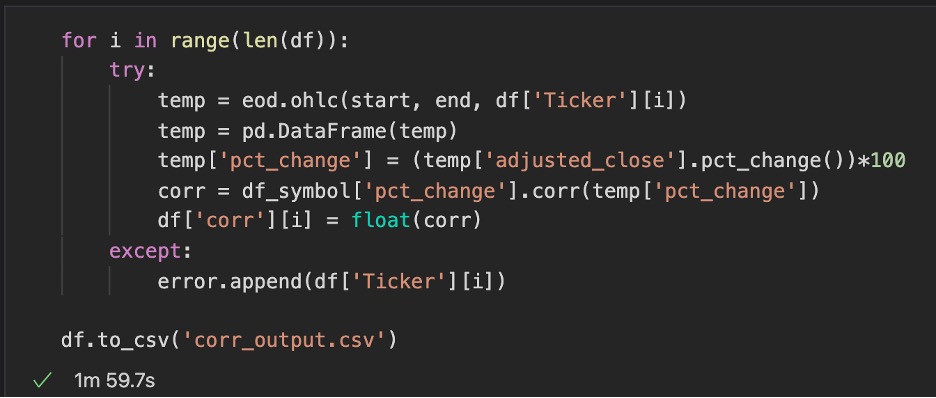
Finally, we’re going to do some calculations and output the results into a csv so that we can make a useful graph. It’s a simple for loop that compares our stock INTC “df_symbol” to the rest of the S&P. Each iteration of i is a ticker from the S&P and a correlation coefficient is calculated with respect to our stock INTC. The output is written into a csv.
Above is a sample of the output results we get from running the script. To help us visualize we’ll turn this into a heat map using JMP. That way we can see qualitatively which stocks are the most/least correlated to our stock INTC.
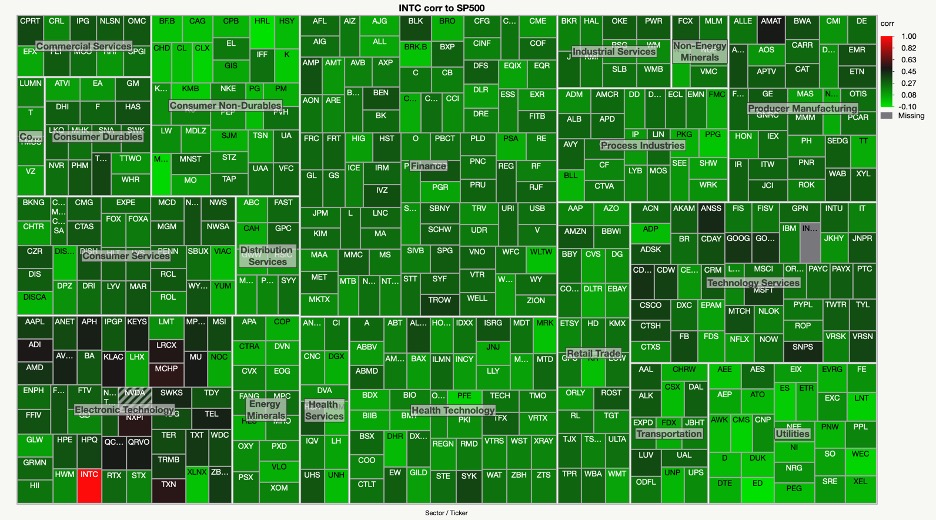
At once you can see that the brightest red spot is our stock itself because it has 100 percent correlation to itself. Looking at it a bit more we see that the bottom left corner has a darker red shade while the bottom right corner is more light green. The bottom left holds the tickers which are in the same sector as INTC (Electronic Technology) which makes sense that they are correlated. The bottom right section is the Utilities sector which doesn’t have a whole lot to do with the technology sector, also making sense with the lack of correlation. We can take a more quantitative approach at finding a hedge by sorting our initial output to get the most and least correlated.
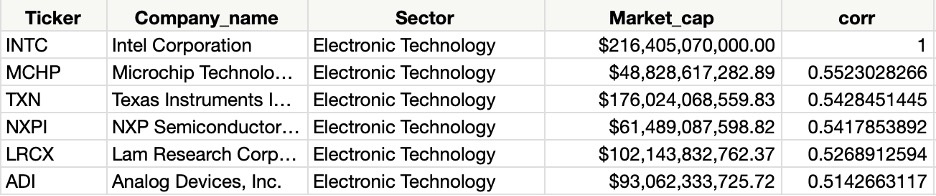
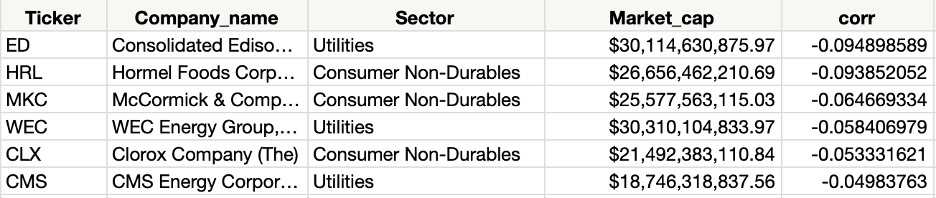
Above are the most and least correlated to our chosen stock over the past year. Now that you have this information you can make plays as you like. This example doesn’t show strong correlation for top or bottom but that will be the case for most stocks within the S&P 500 as they behave similarly. More realistic results will be using a larger set of tickers to compare against your stock, which means creating your own universe of symbols to analyze. The same methods can be used for this but visually inspecting sectors for qualitative hedges would be difficult when the symbols get into the thousands.
Code
import pandas as pd
import eod_ohlc_pull as eod

df = pd.read_csv('sp500.csv')
df['corr'] = [0.0]*len(df)

start = '2021-03-13'
end = '2022-03-13'
error = []
symbol = 'INTC'
df_symbol = eod.ohlc(start, end, symbol)
df_symbol = pd.DataFrame(df_symbol)
df_symbol['pct_change'] = (df_symbol['adjusted_close'].pct_change())*100

for i in range(len(df)):
    try:
        temp = eod.ohlc(start, end, df['Ticker'][i])
        temp = pd.DataFrame(temp)
        temp['pct_change'] = (temp['adjusted_close'].pct_change())*100
        corr = df_symbol['pct_change'].corr(temp['pct_change'])
        df['corr'][i] = float(corr)
    except:
        error.append(df['Ticker'][i])

df.to_csv('corr_output.csv')