Chapter 4: Expiration Profit and Loss
Summary
This chapter discussed the basic expiration behaviors of Call/Put options. It did not take into account the premium required to attain Call/Put options
but the parity graphs and slopes. Parity graphs show the value of an option at expiration. If for example a trader bought a 95 Call and at
expiration the underlying is at 100, the parity graph will show that the value of the bought Call is now worth $5.00. On the other hand,
if the underlying was at 90, the bought Call would be worth 0. Parity graphs display the intrinsic value of the option at expiration.
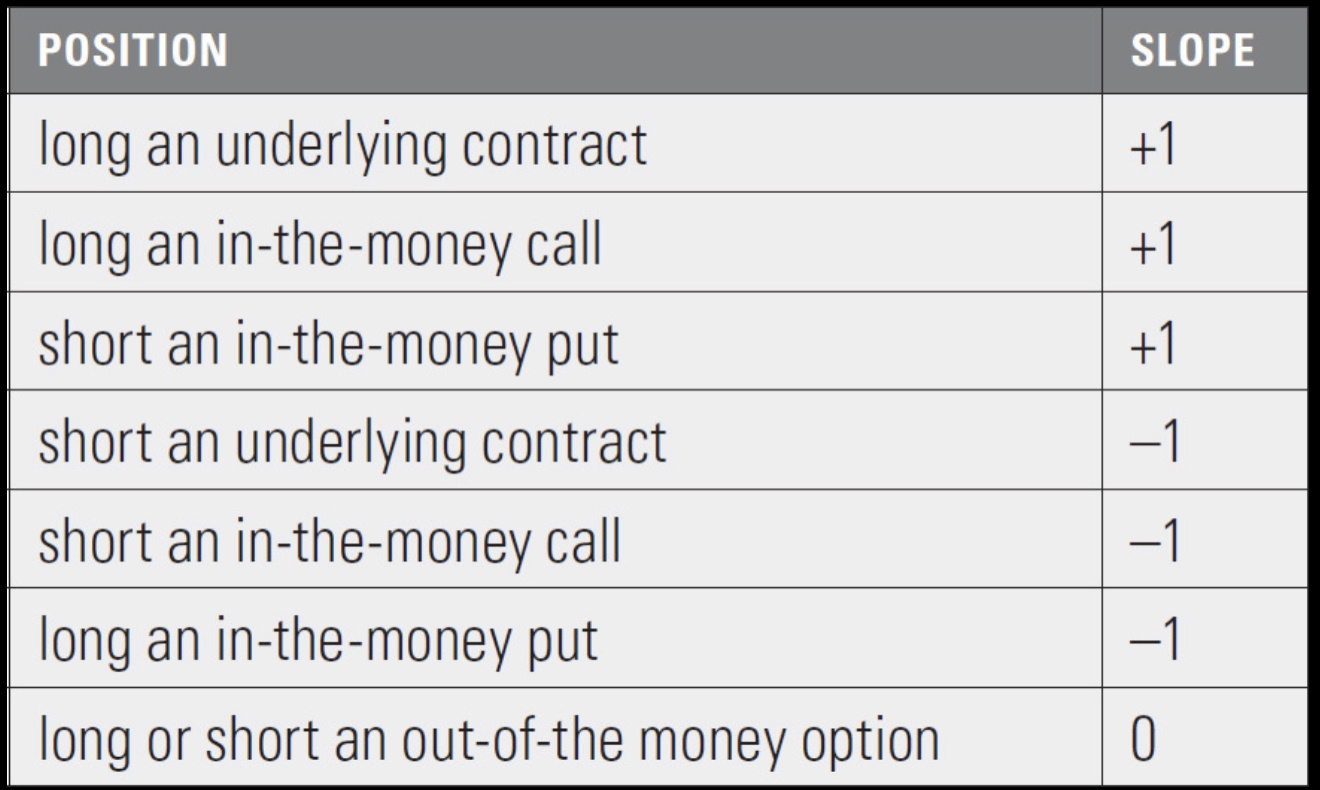
The chapter also discussed the slope of the parity graphs. The slopes define the change in option value with respect to the change in the
underlying at expiration. A slope of +1/-1 represents a Call/Put moving directly at a one-to-one ratio of the underlying, meaning that these
options are in the money. A slope of 0 means that the option value does not change as the option is out of the money. The chapter gave a basic
understanding at what an option contract is worth at expiration with the use of parity graphs. They gave us a glimpse of delta by introducing
slopes of the parity graphs.
Exercise problems:
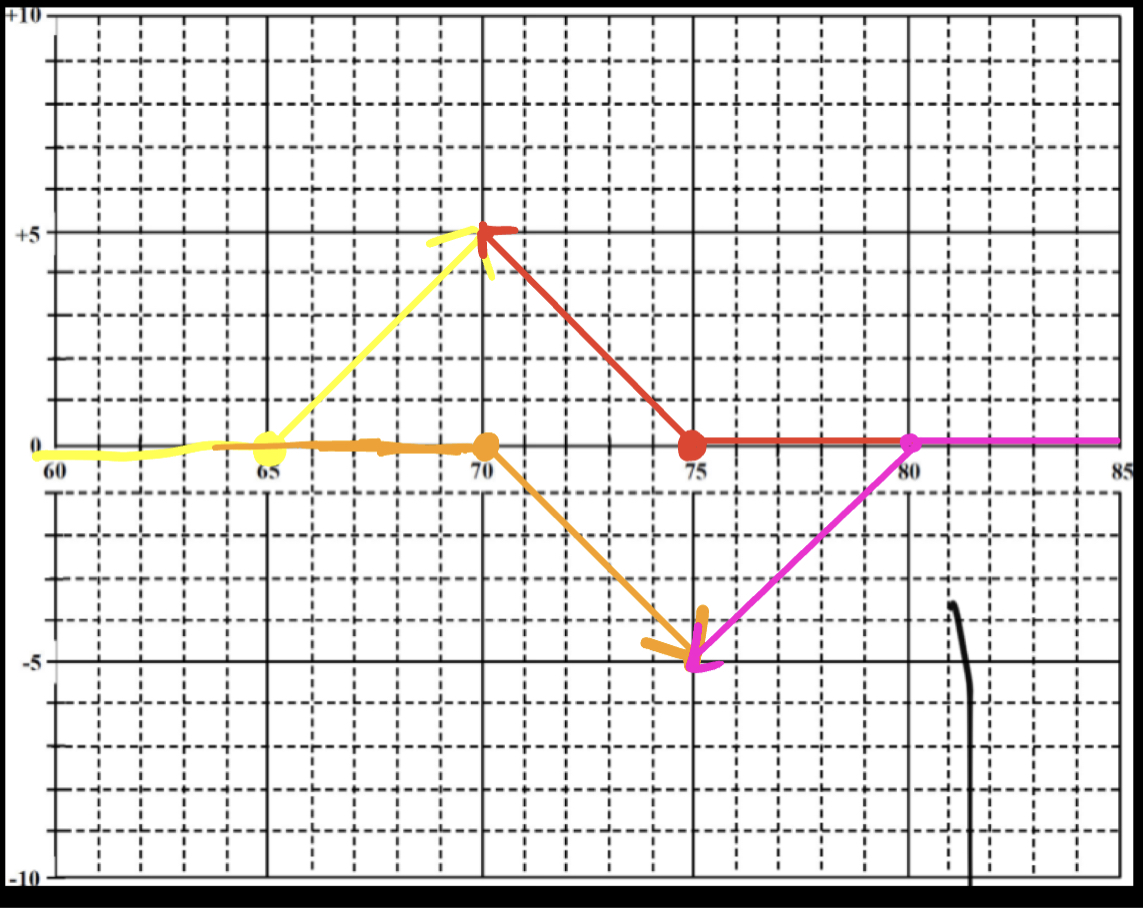
1. Using the grid below, draw the parity graphs (the value at expiration) for the following positions:
a. long a 65 call (yellow)
b. short a 70 call (orange)
c. long a 75 put (red)
d. short an 80 put (purple)
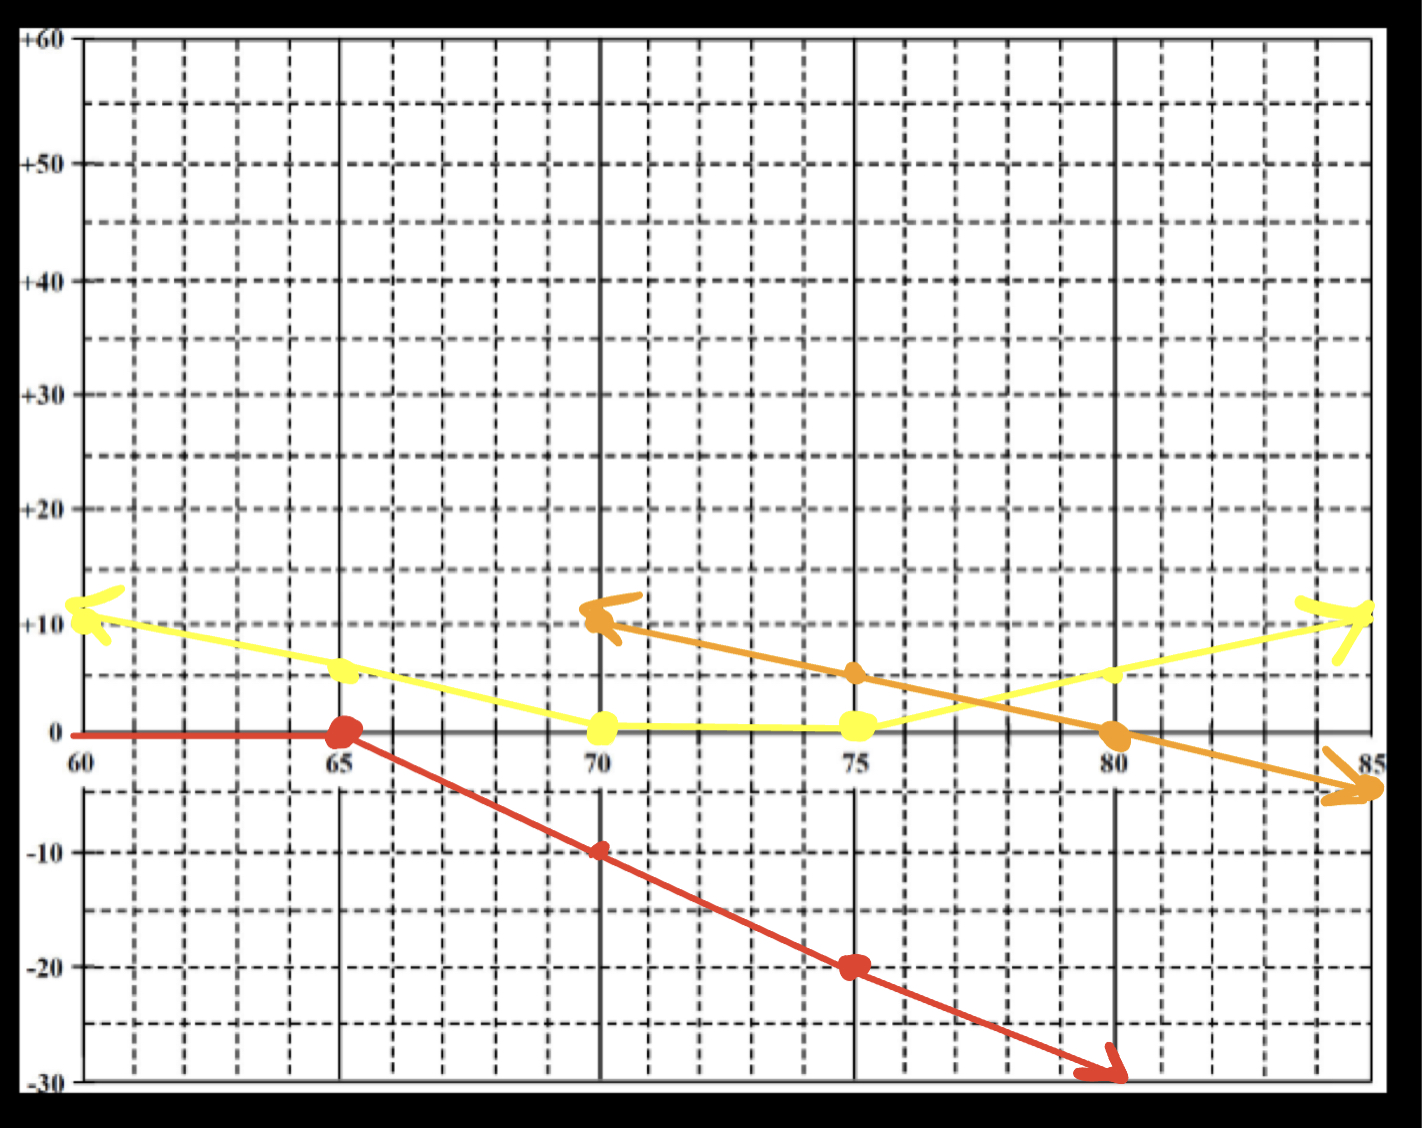
2. Using the grid below, draw the parity graphs (the value at expiration) for the following combination positions:
a. long a 70 put and long a 75 call (yellow)
b. long an 80 put and short an 80 call (orange)
c. short two 65 calls (red)
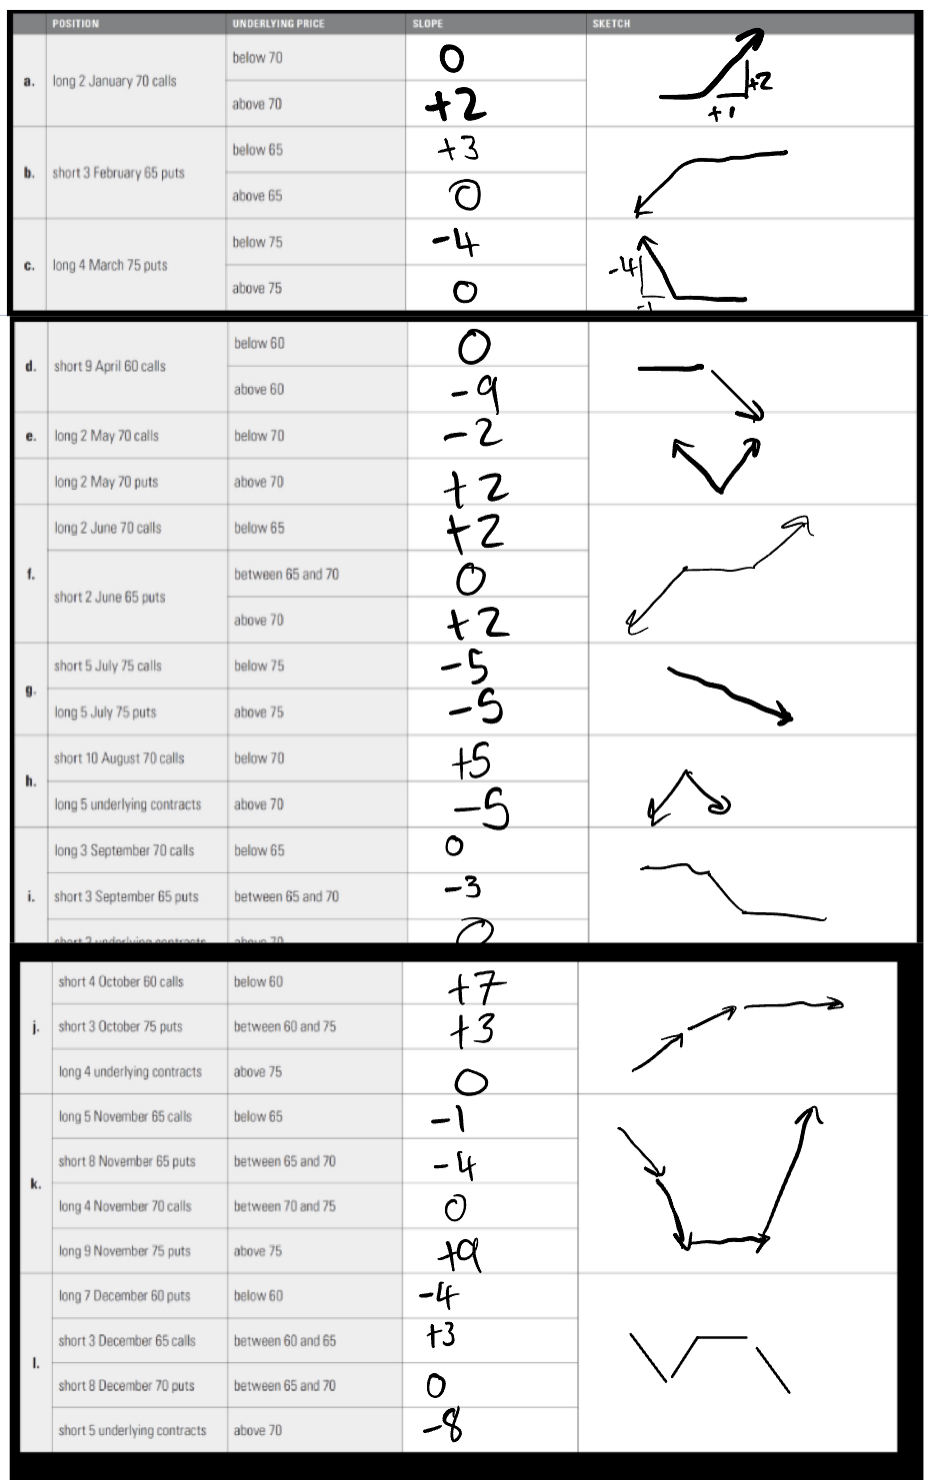
3. The slopes of the various option and underlying positions at expiration can be summarized as follows:
For each position below, what is the slope of the expiration graph over the given underlying price intervals? From these slopes,
sketch the shape of the expiration P&L graph. (The sketch need not be to scale-the approximate shape is sufficient.)
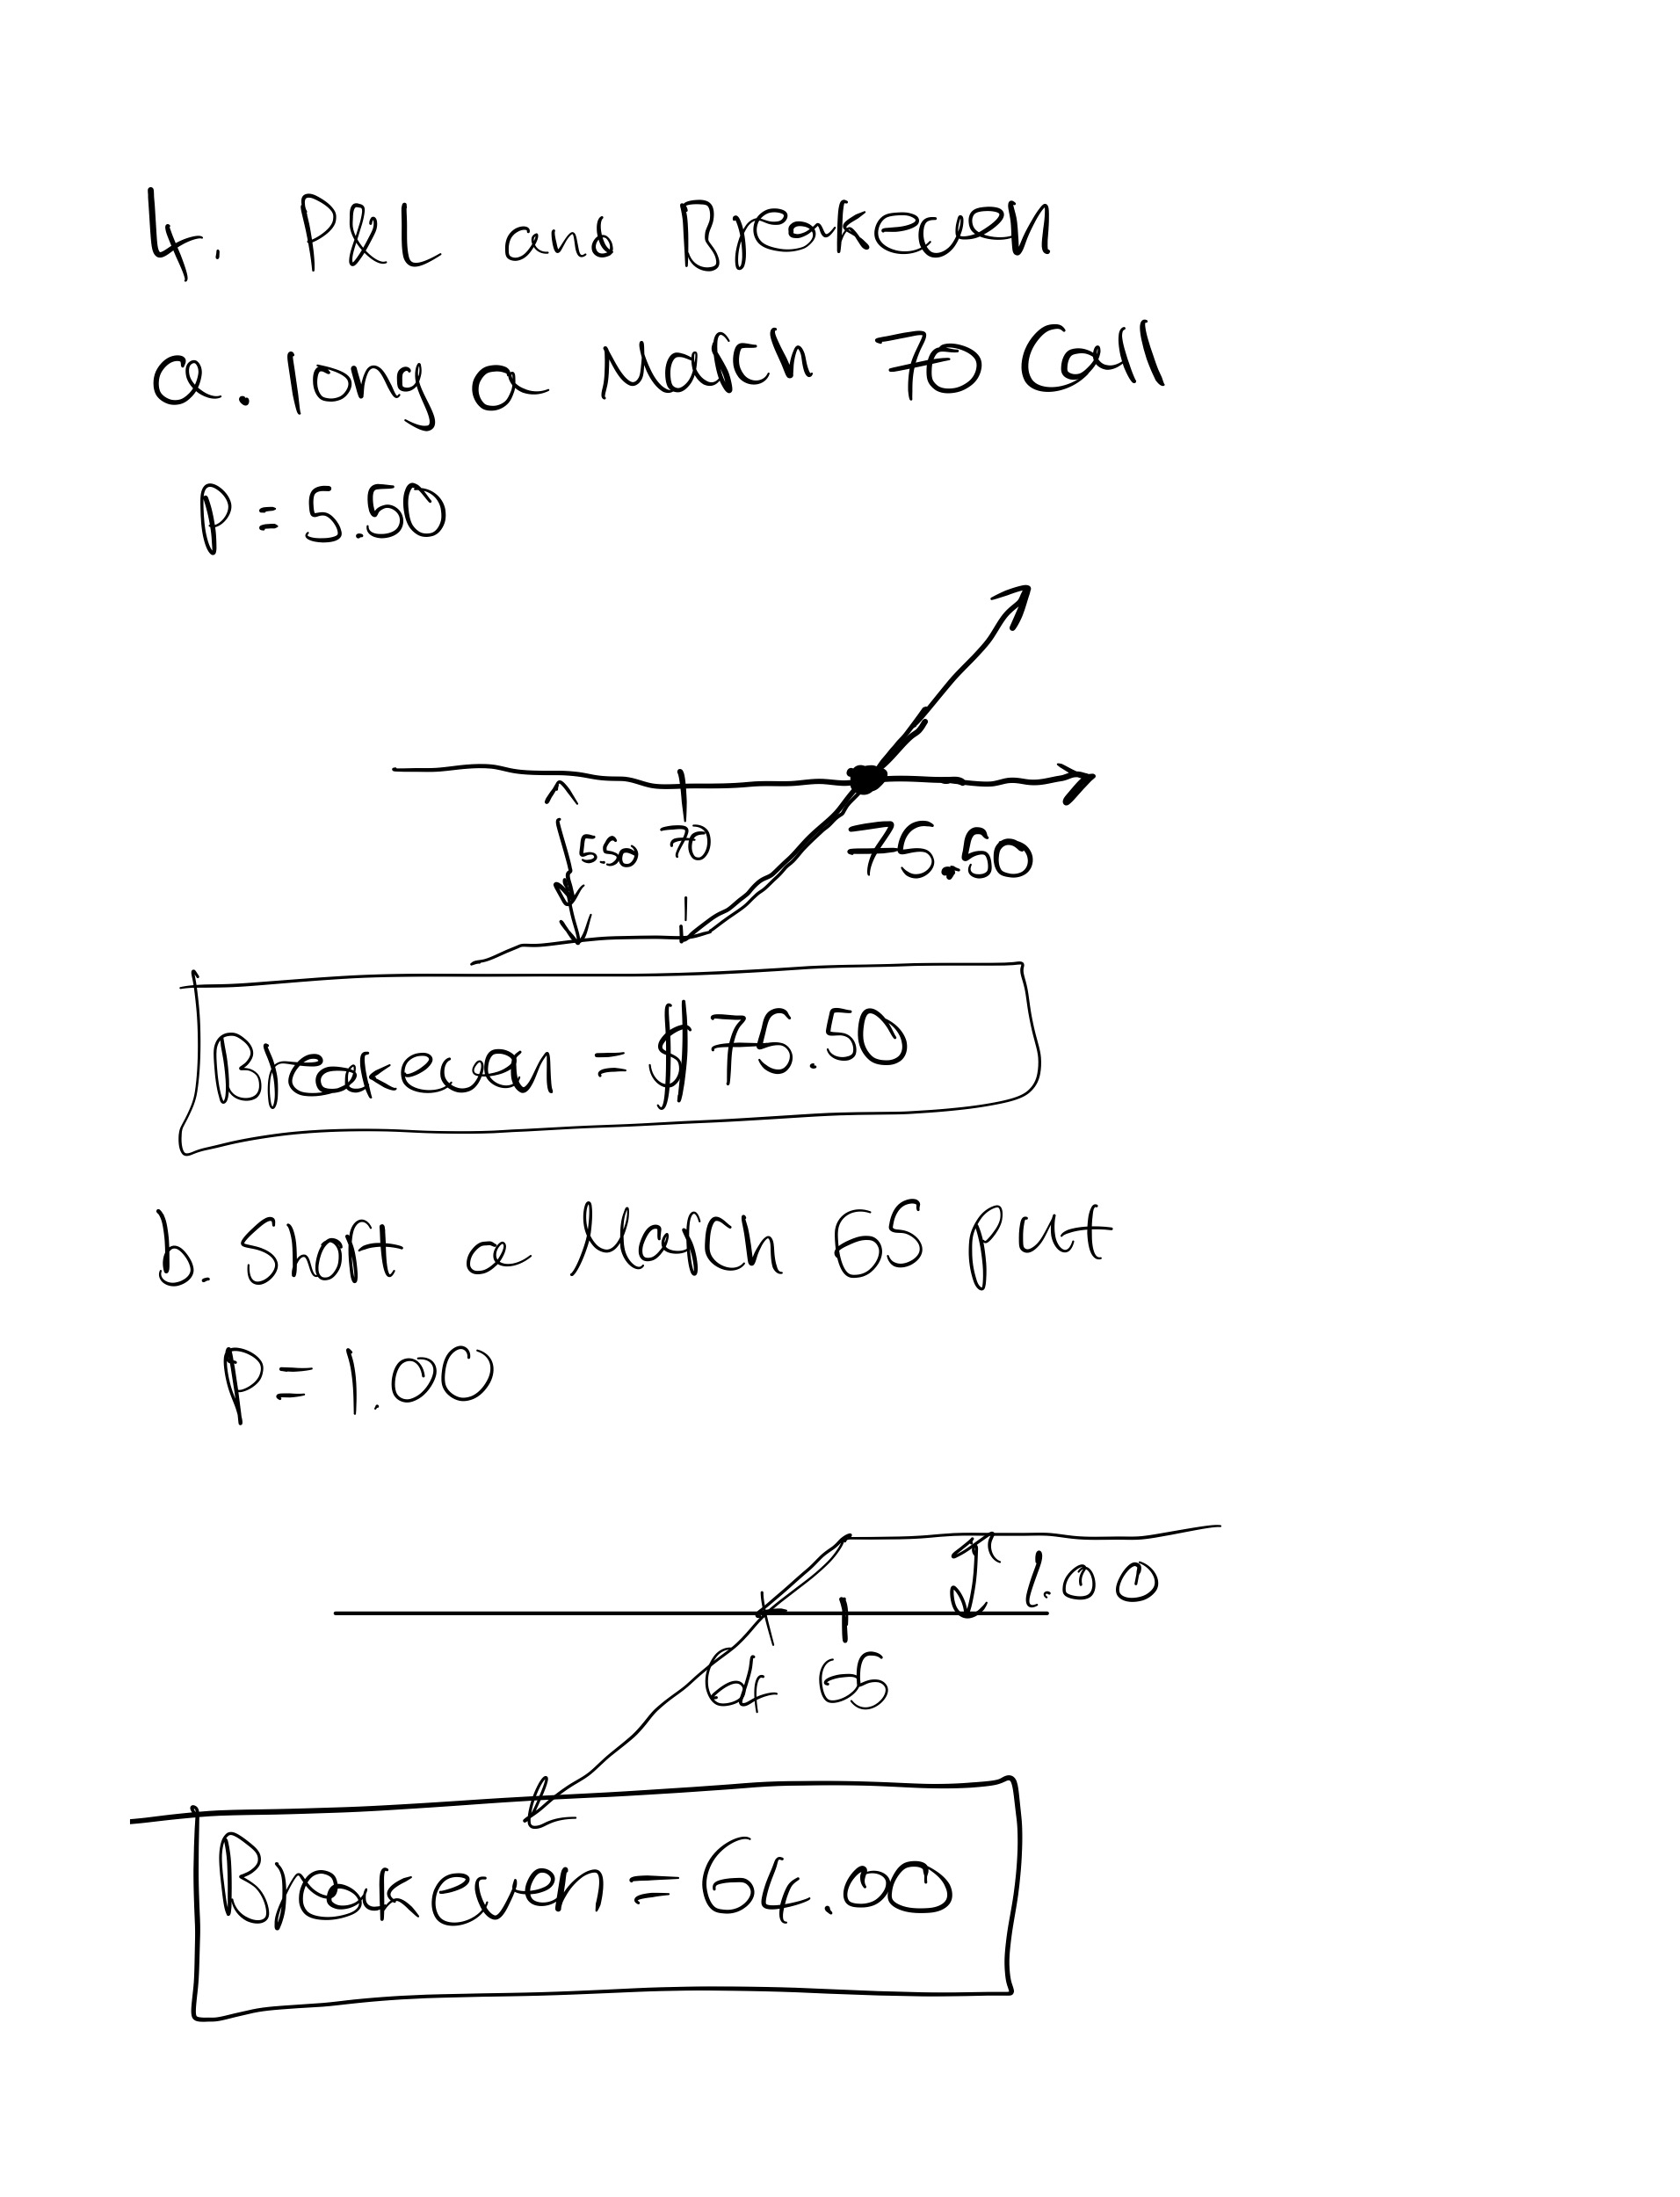
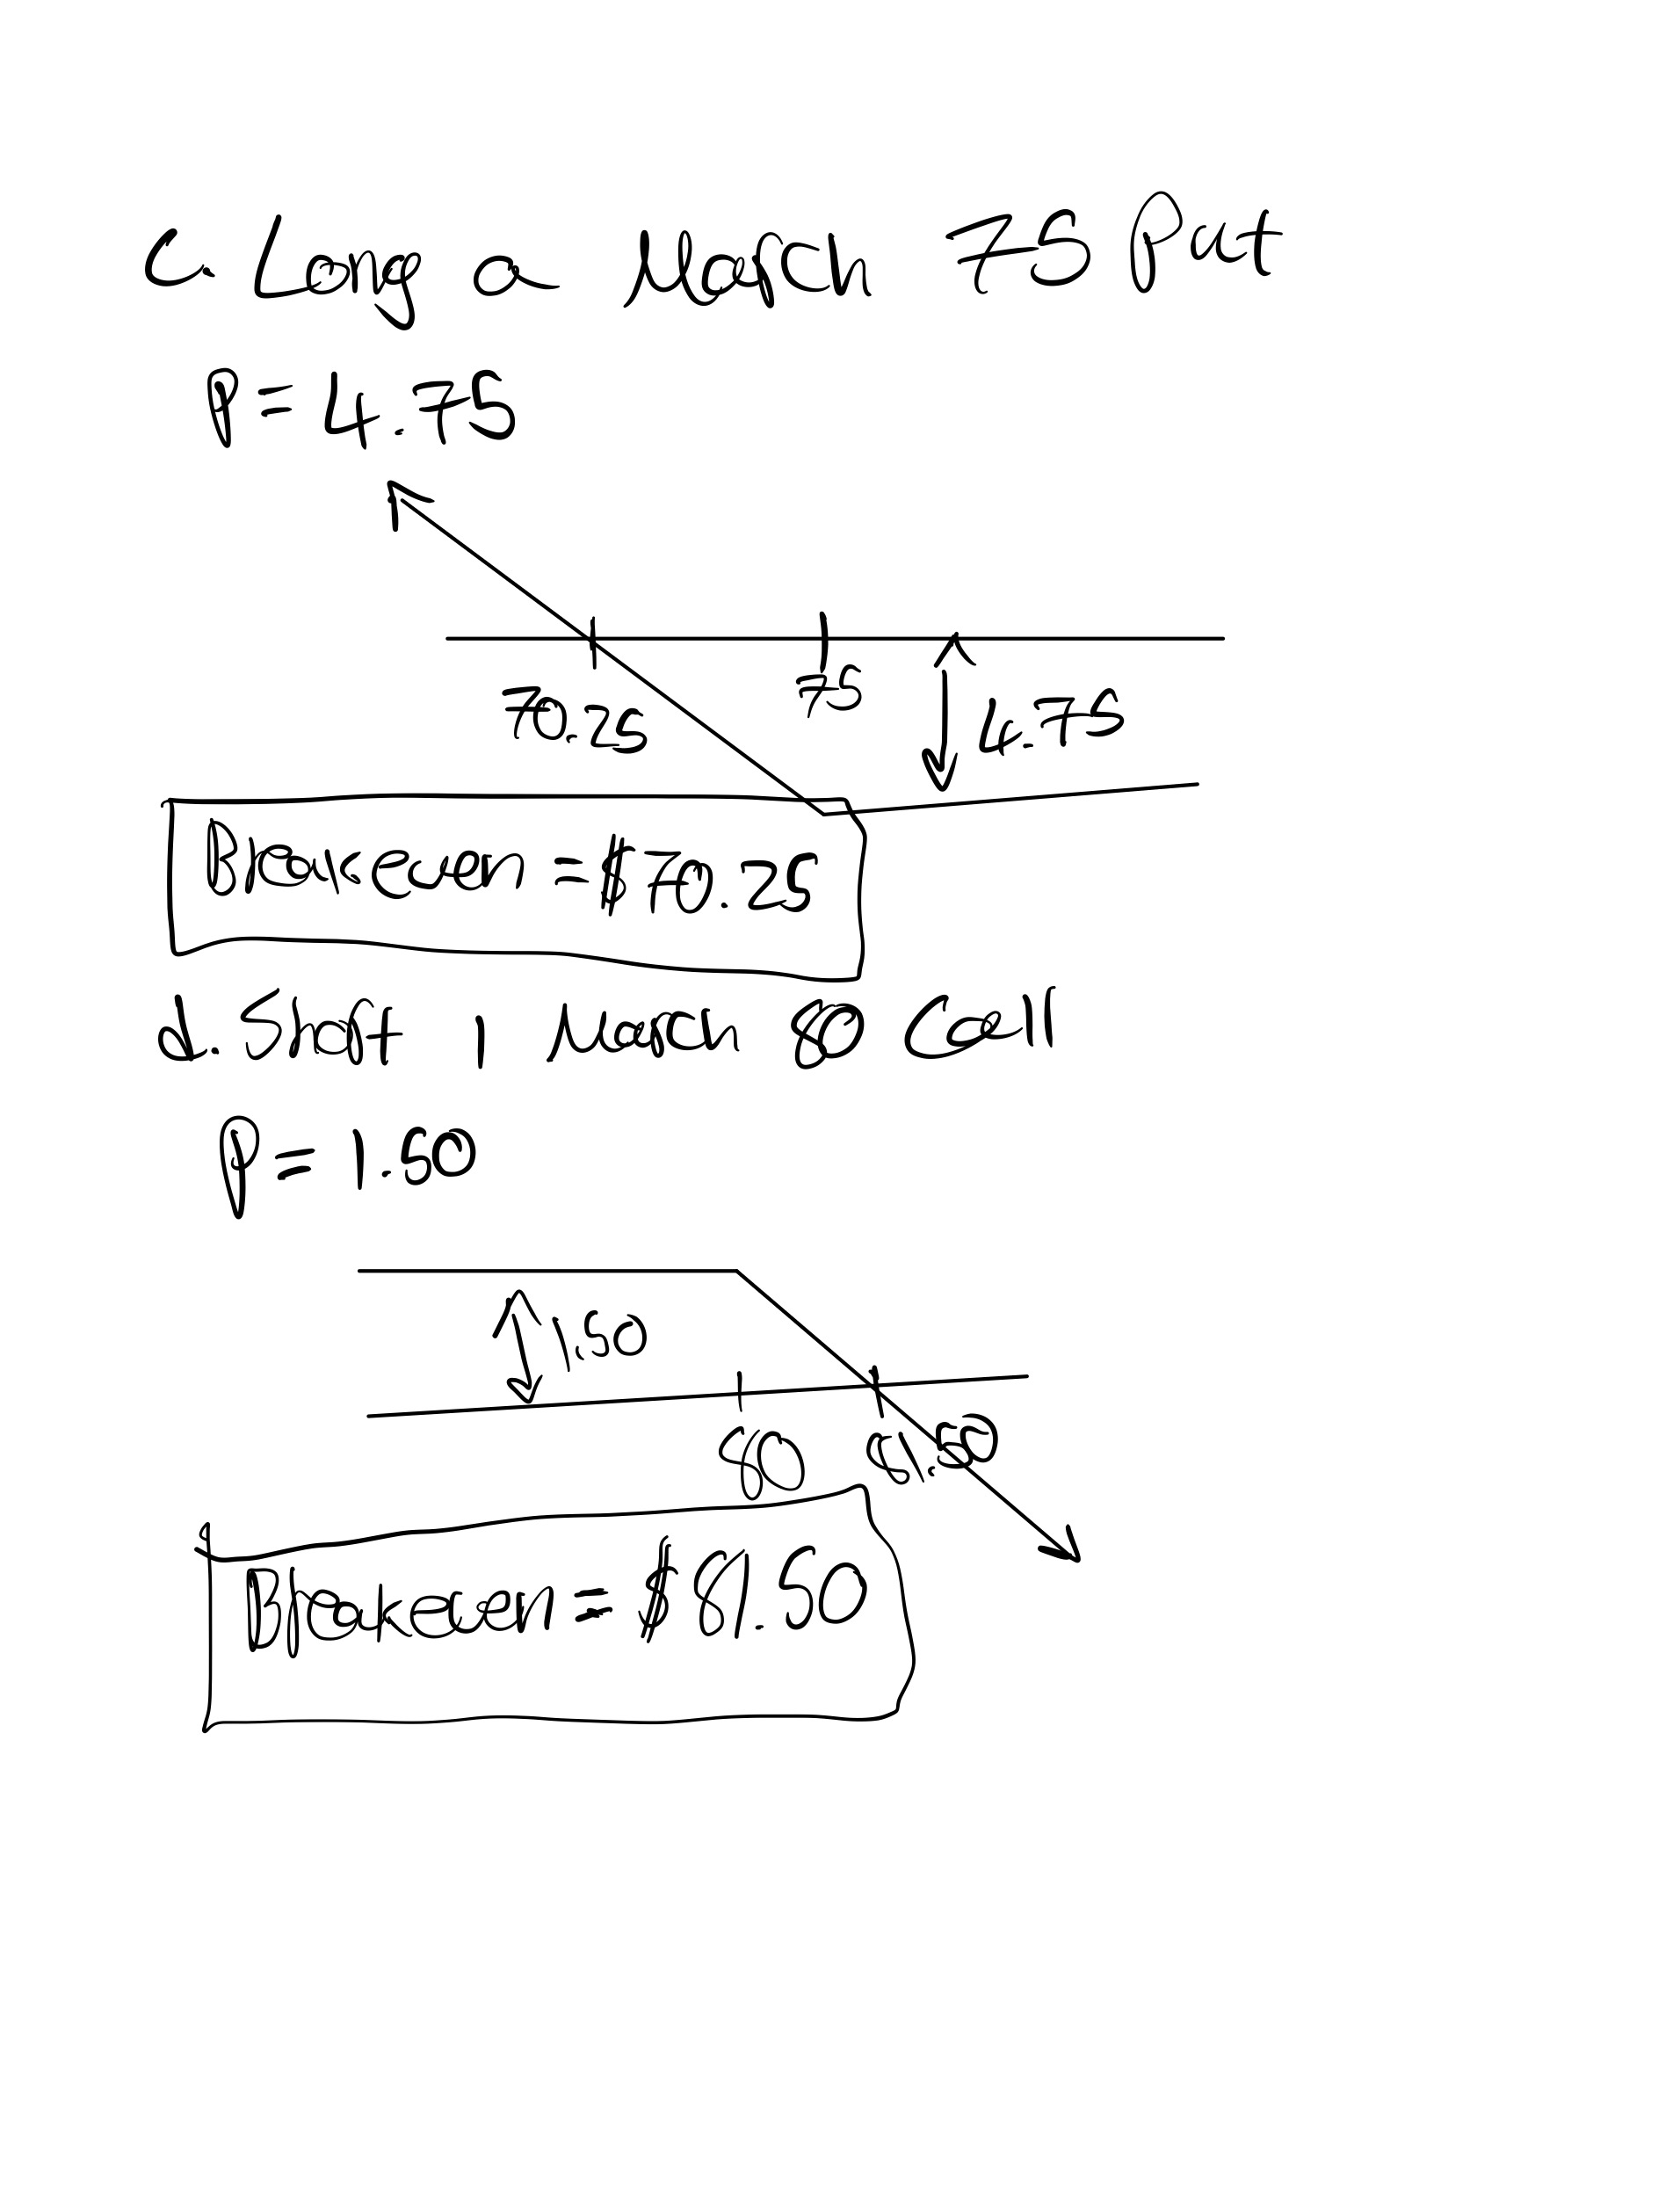
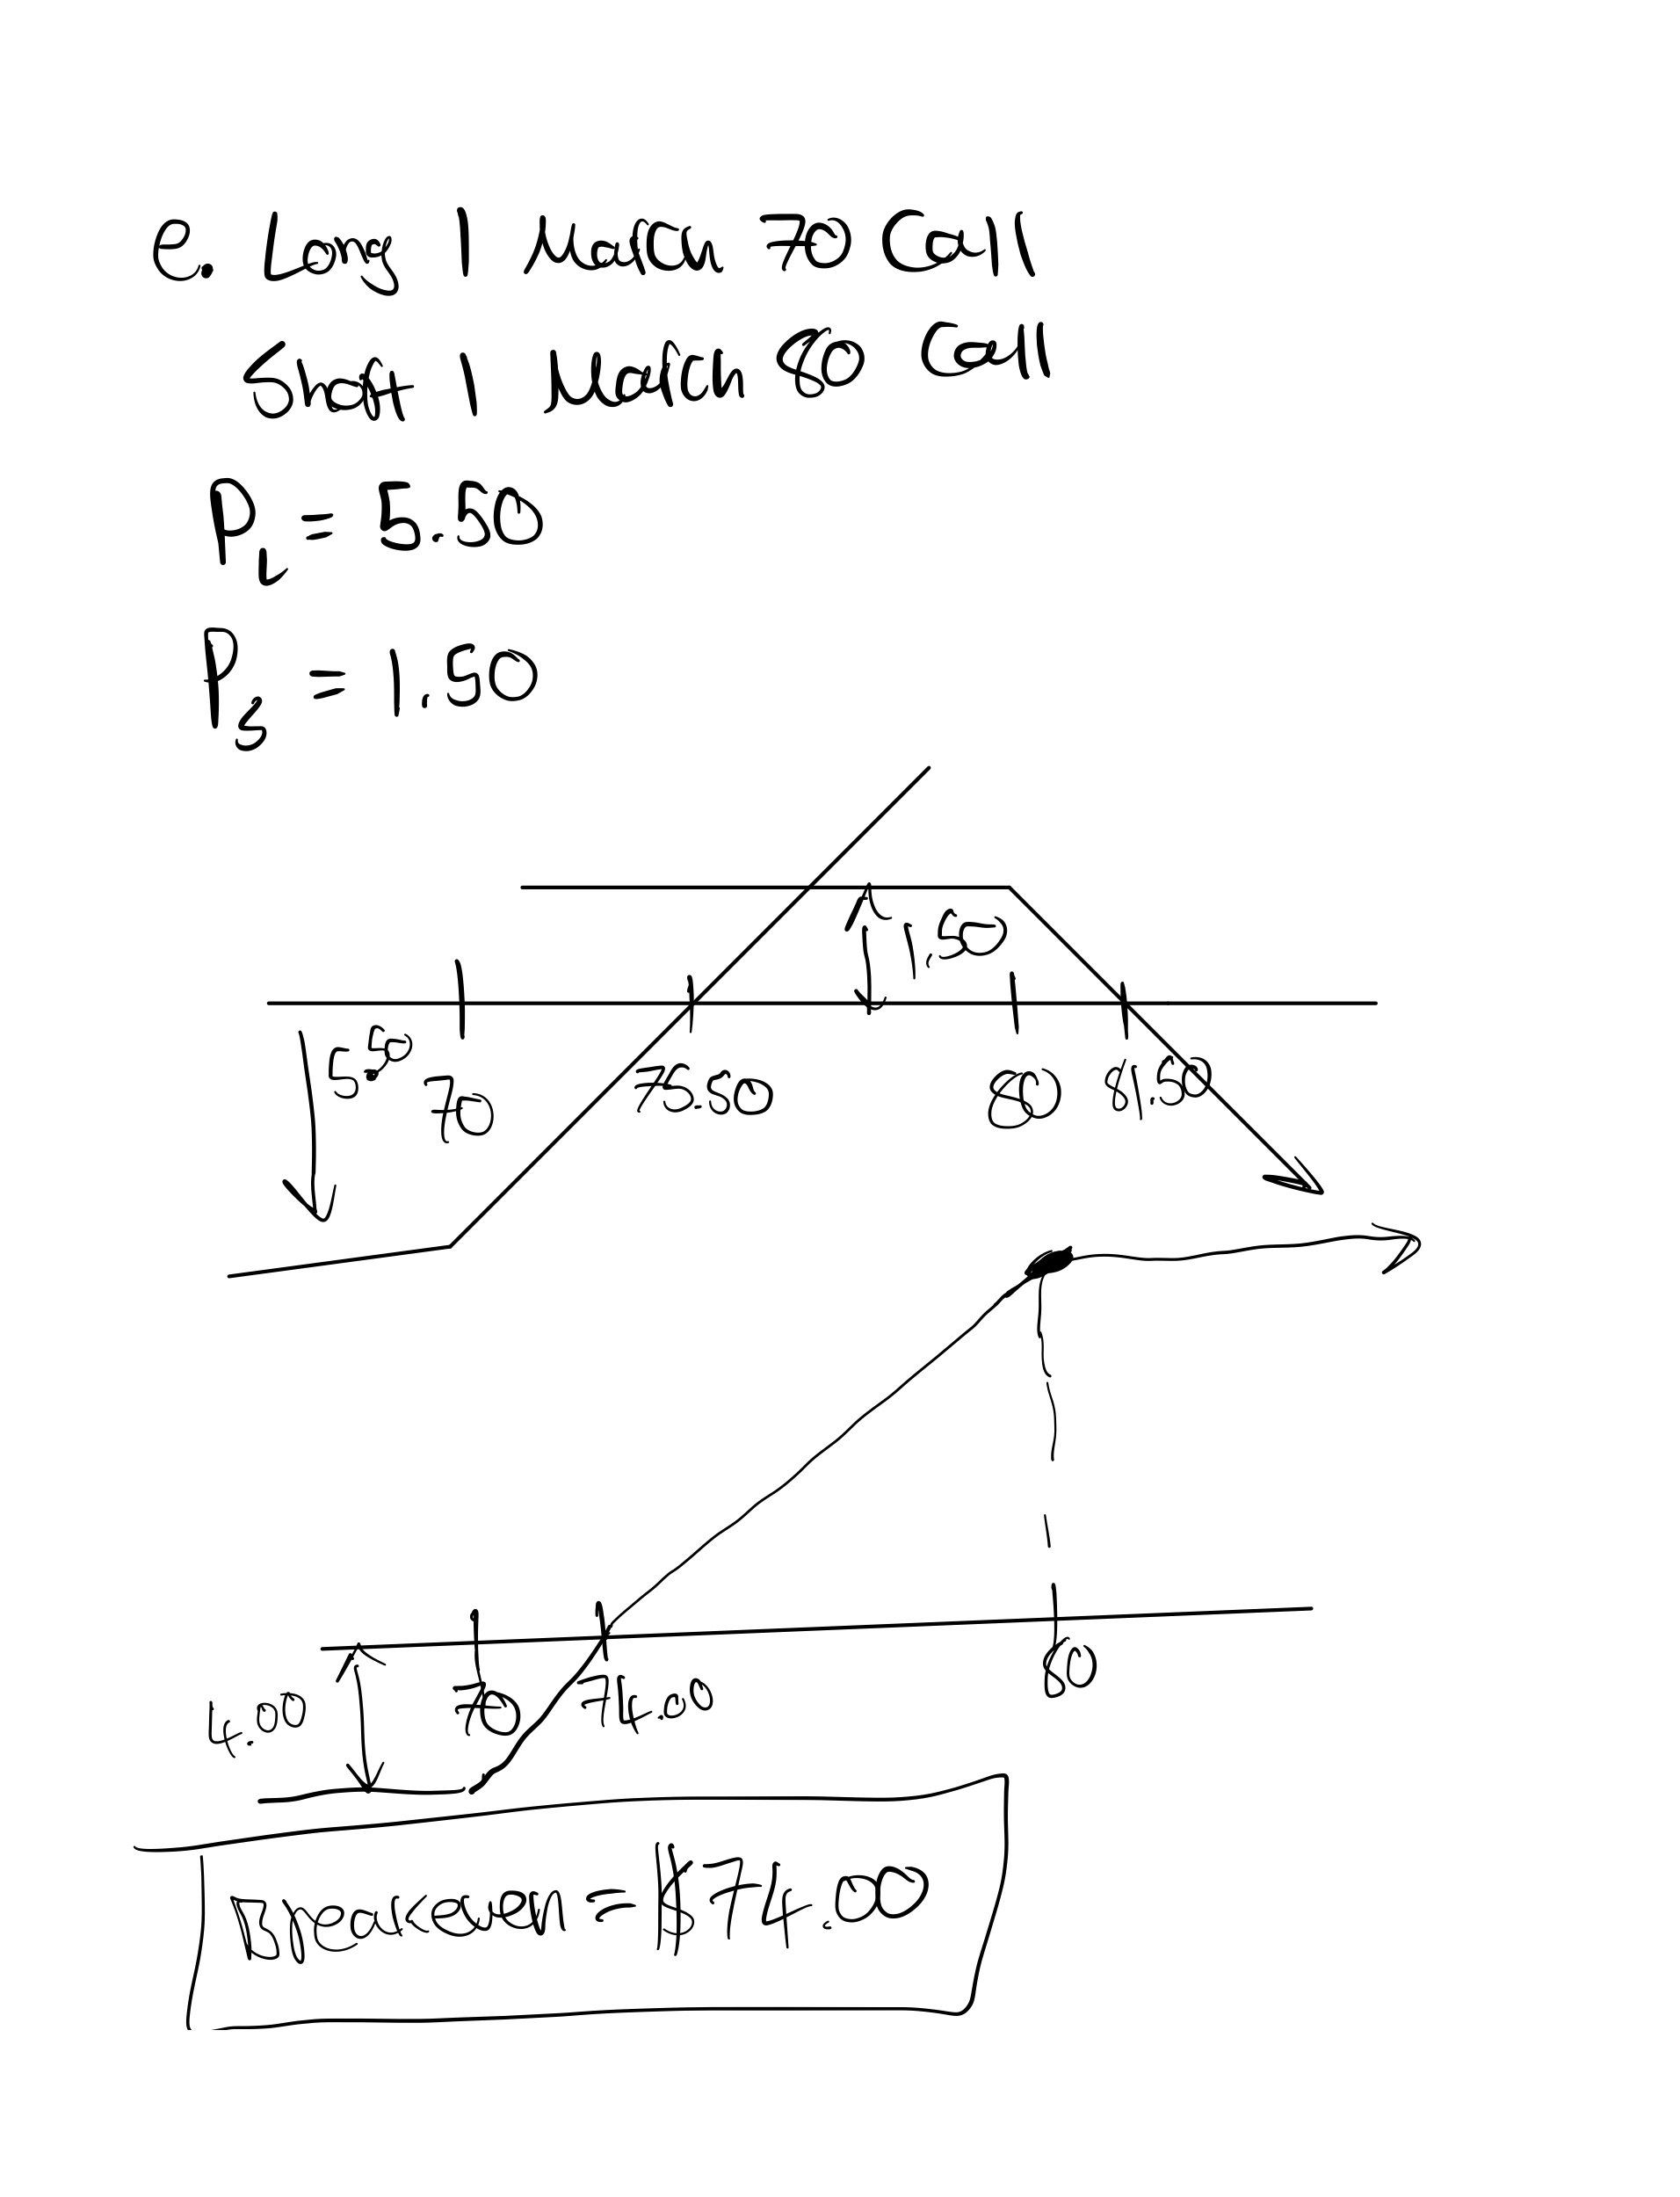
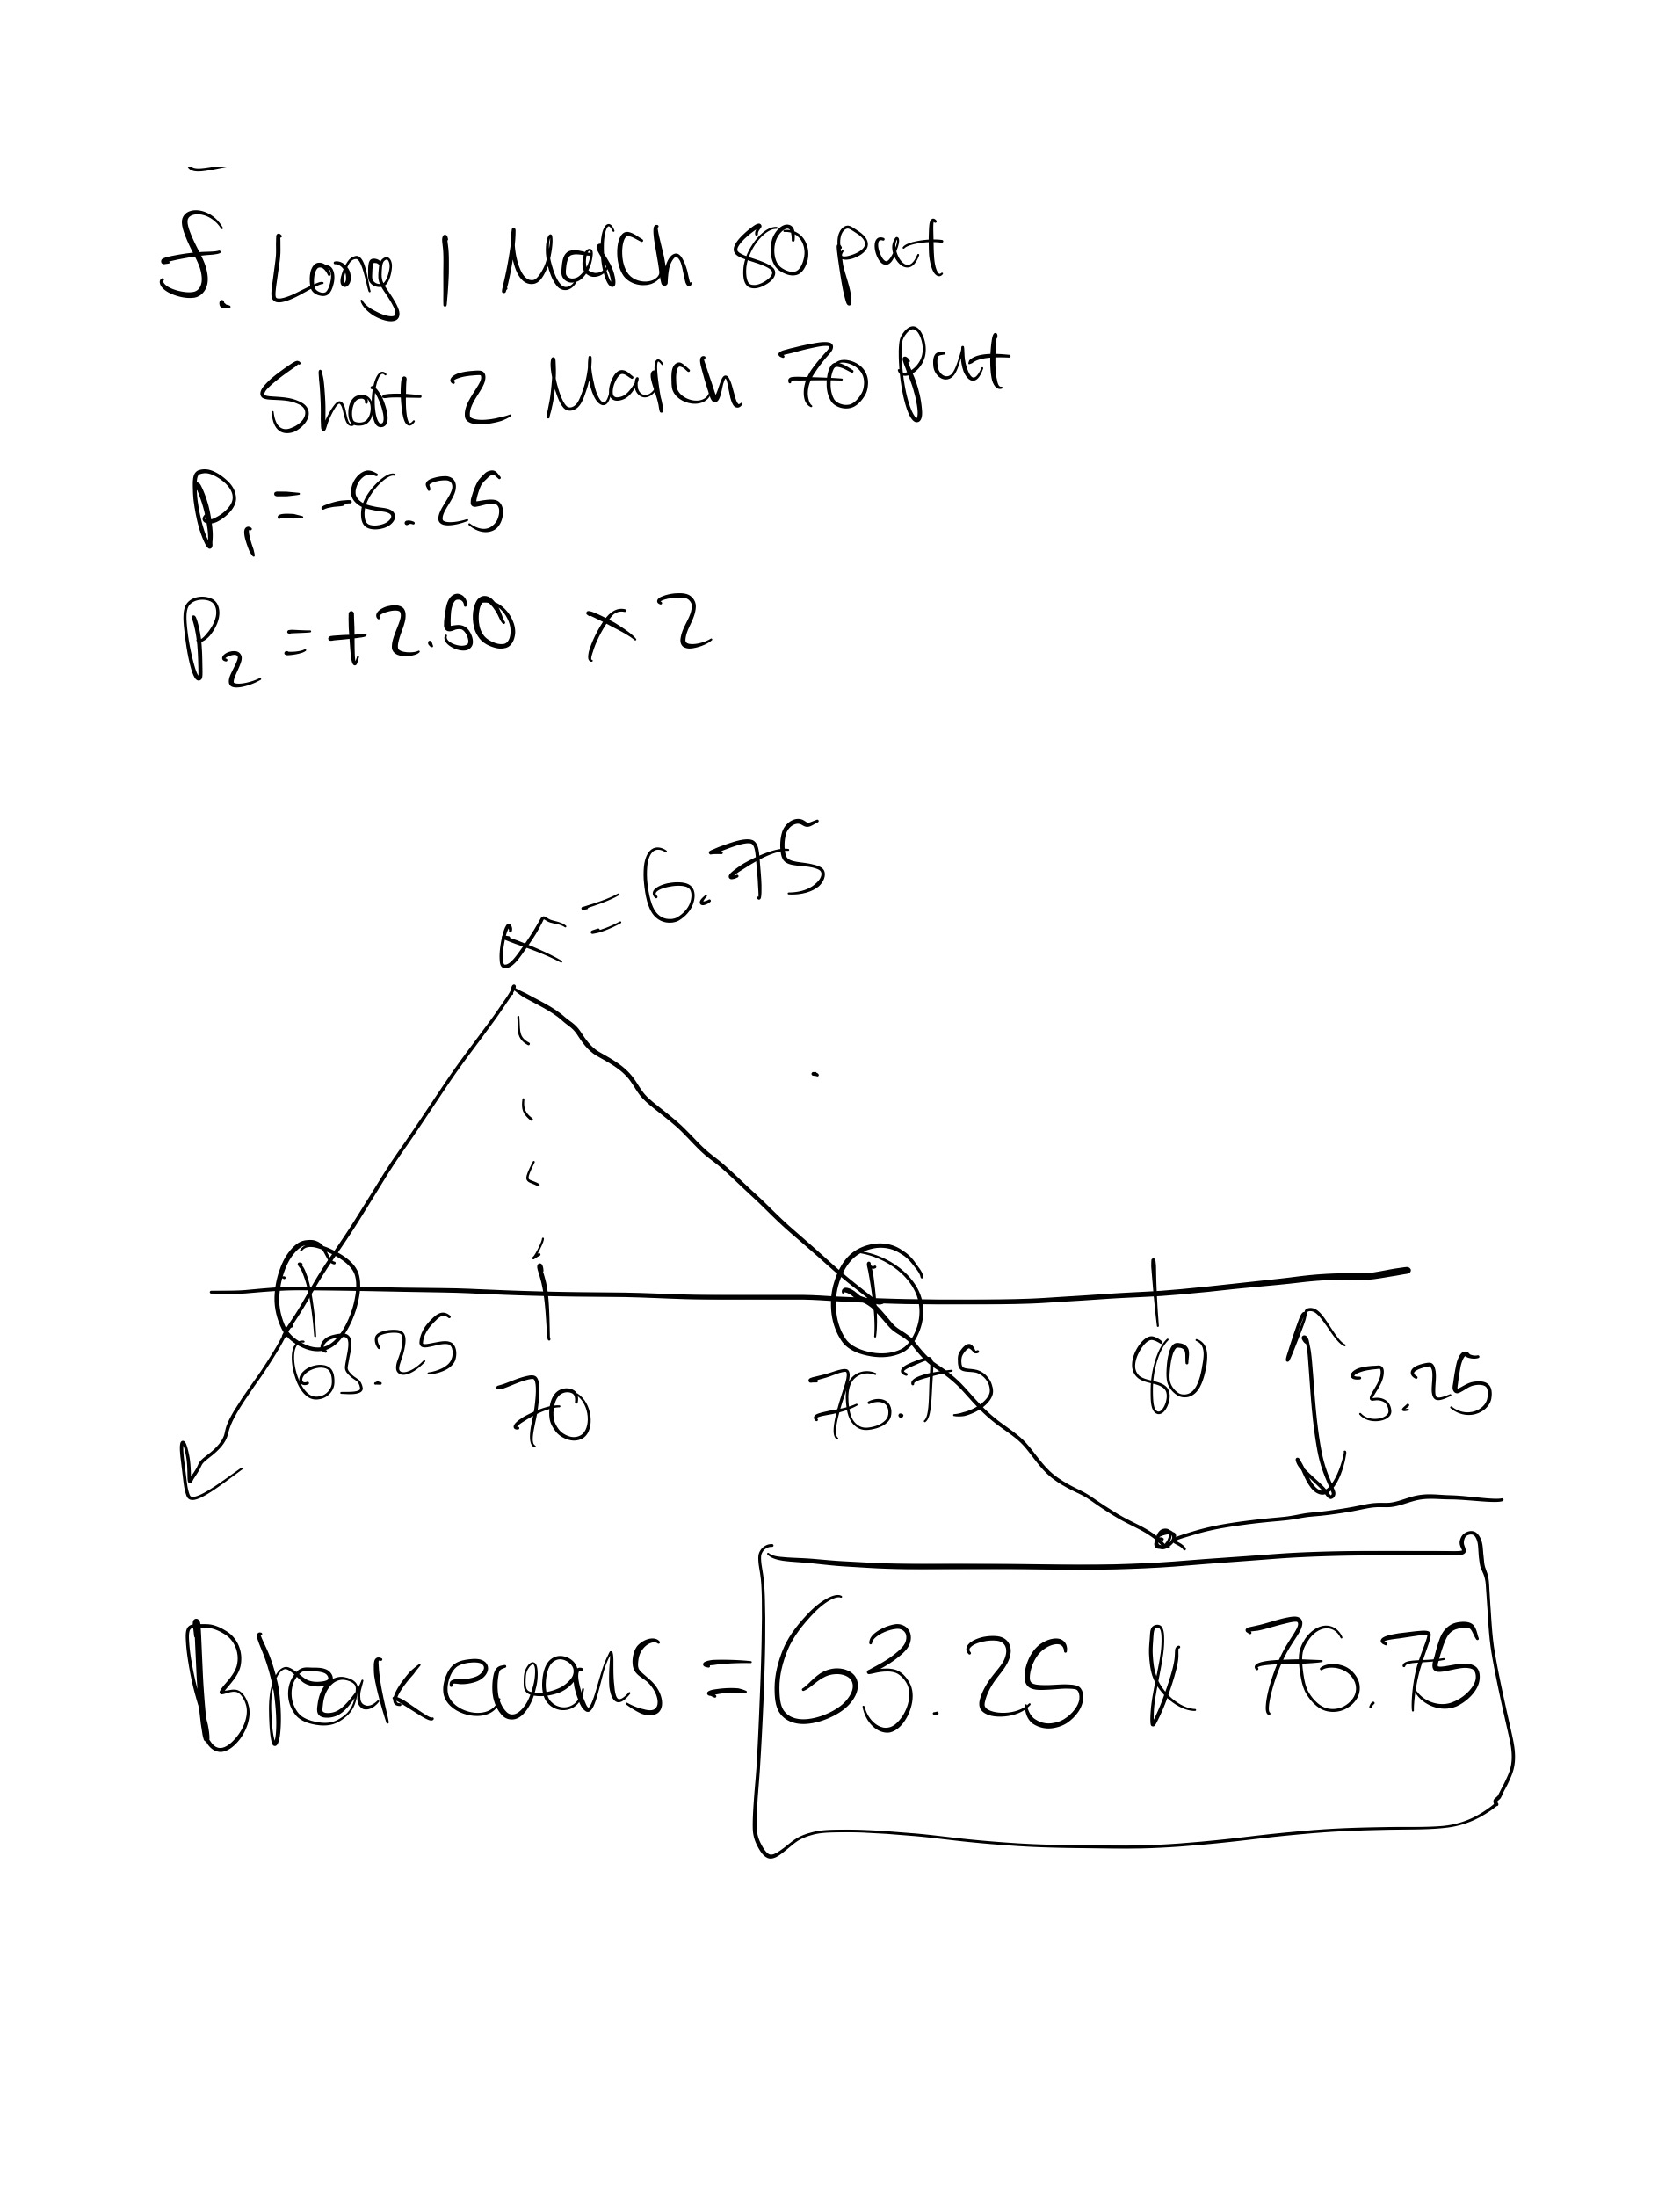
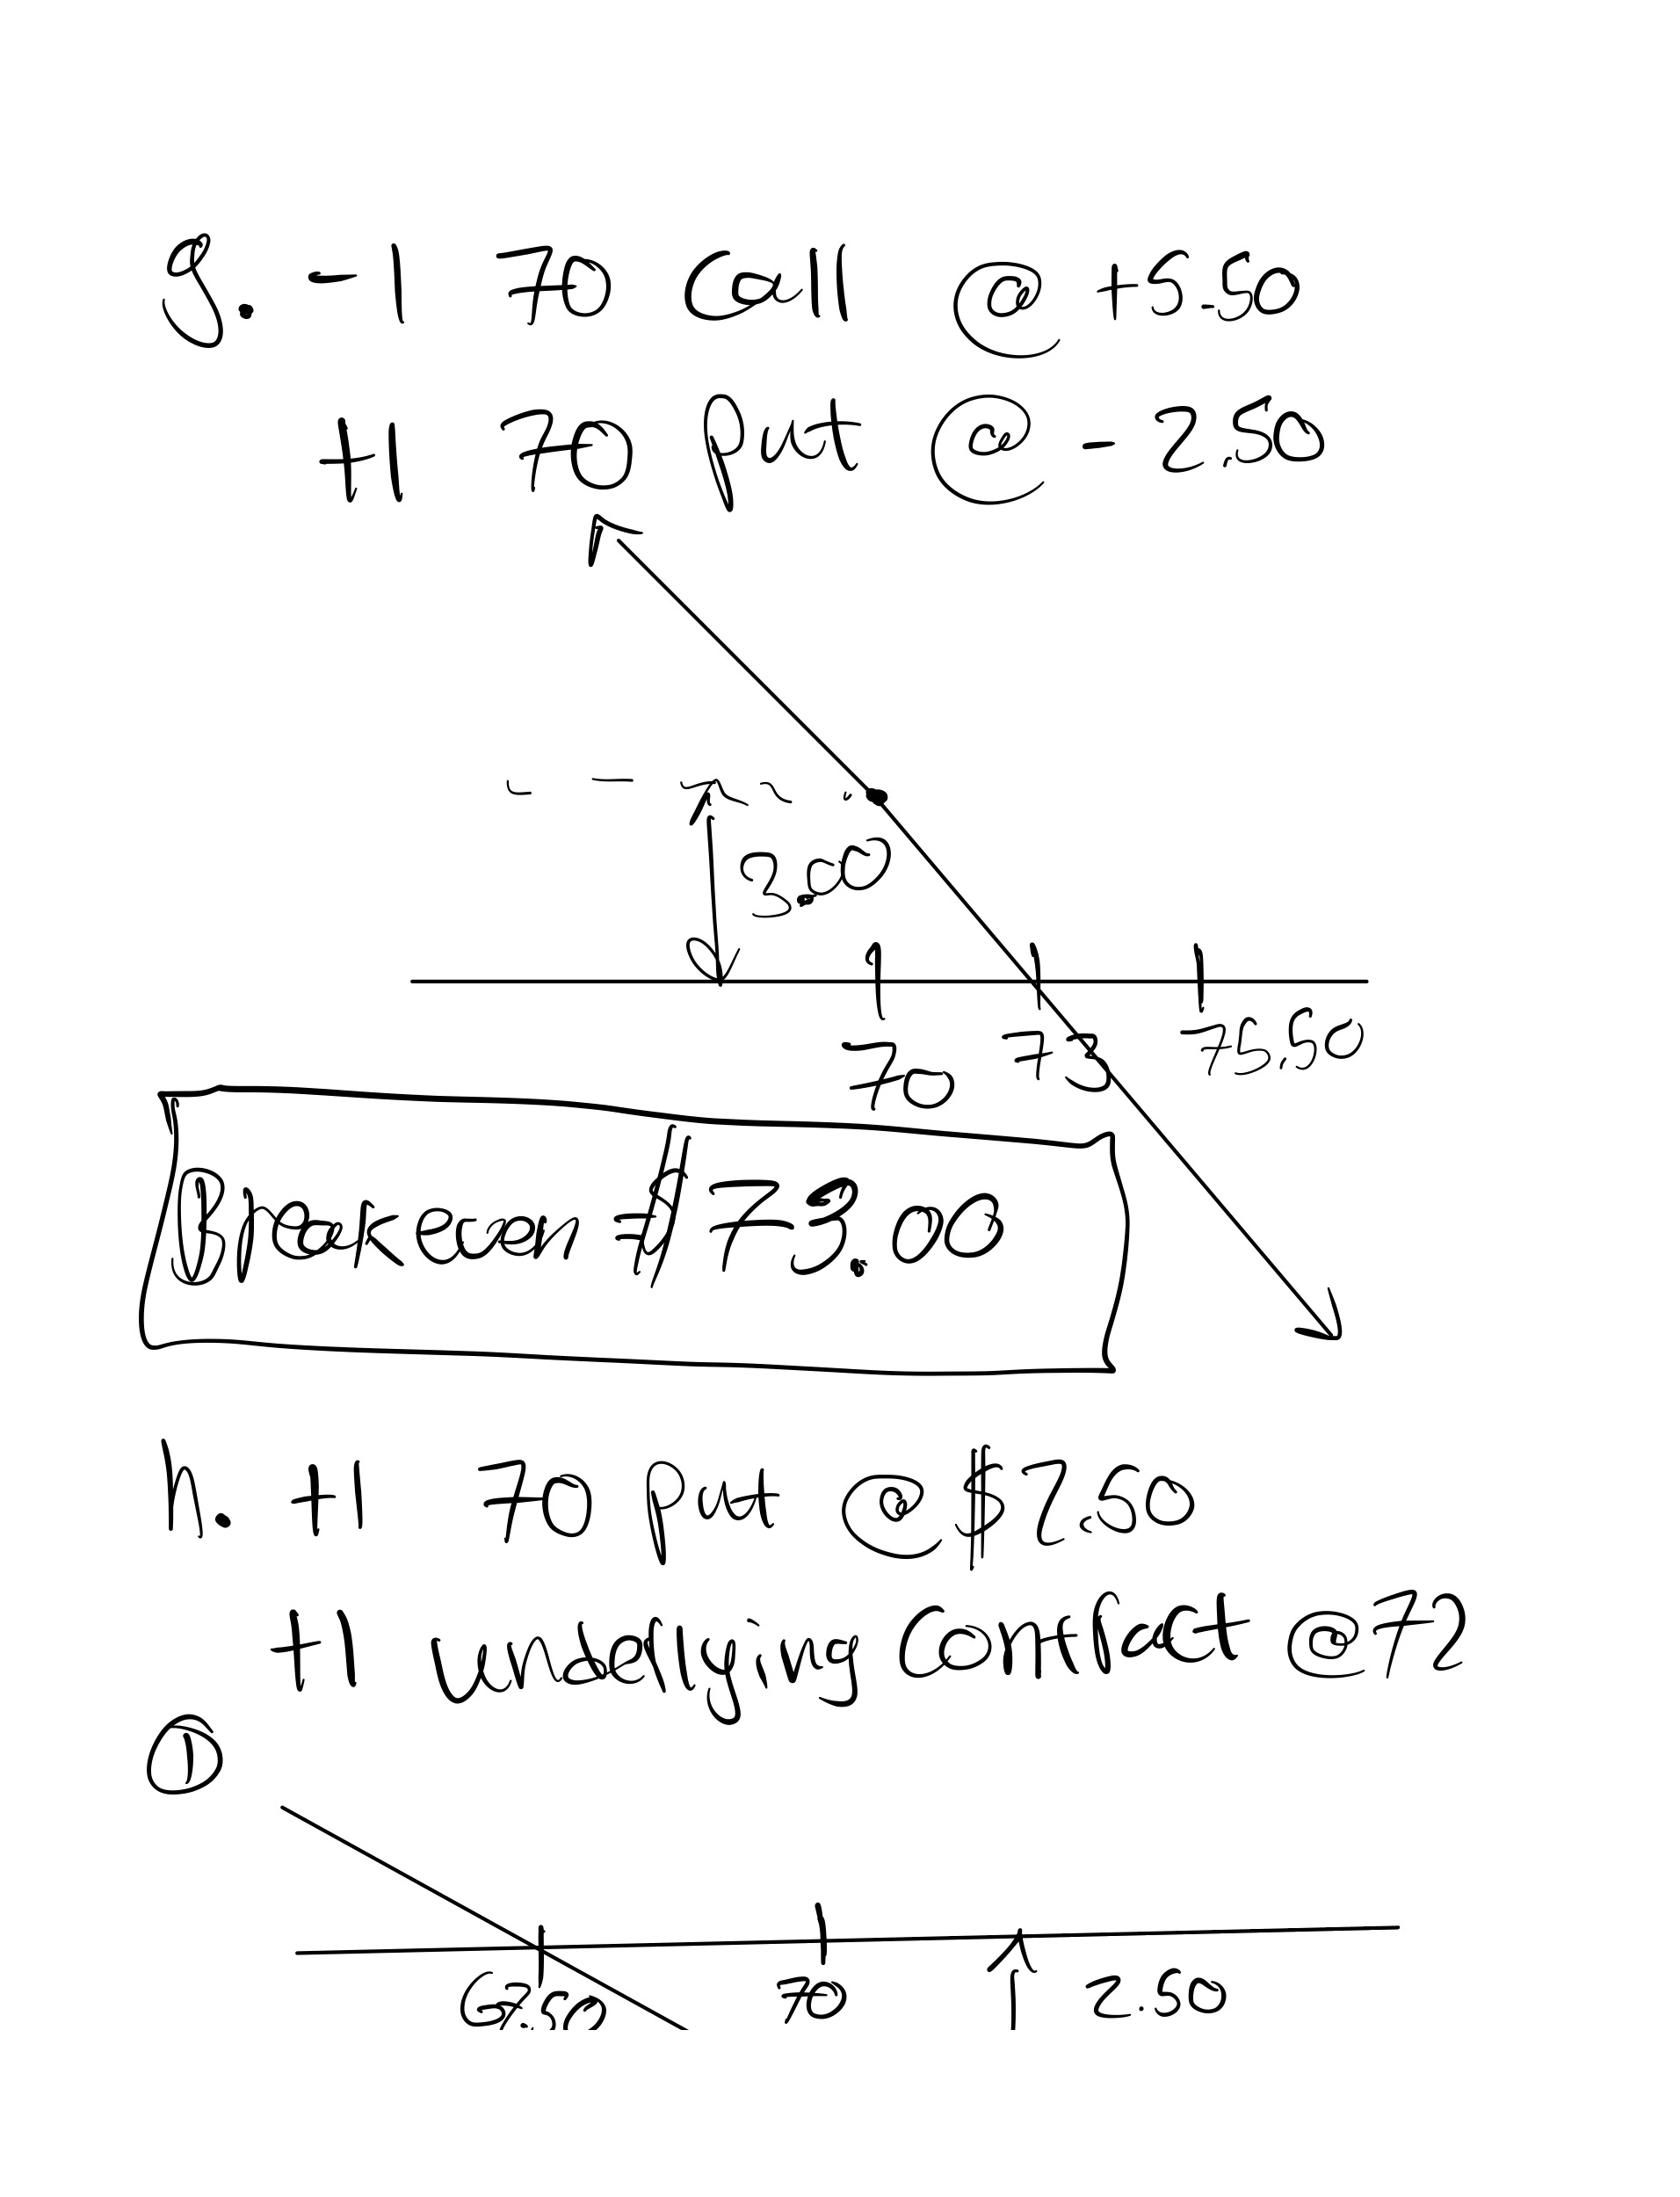
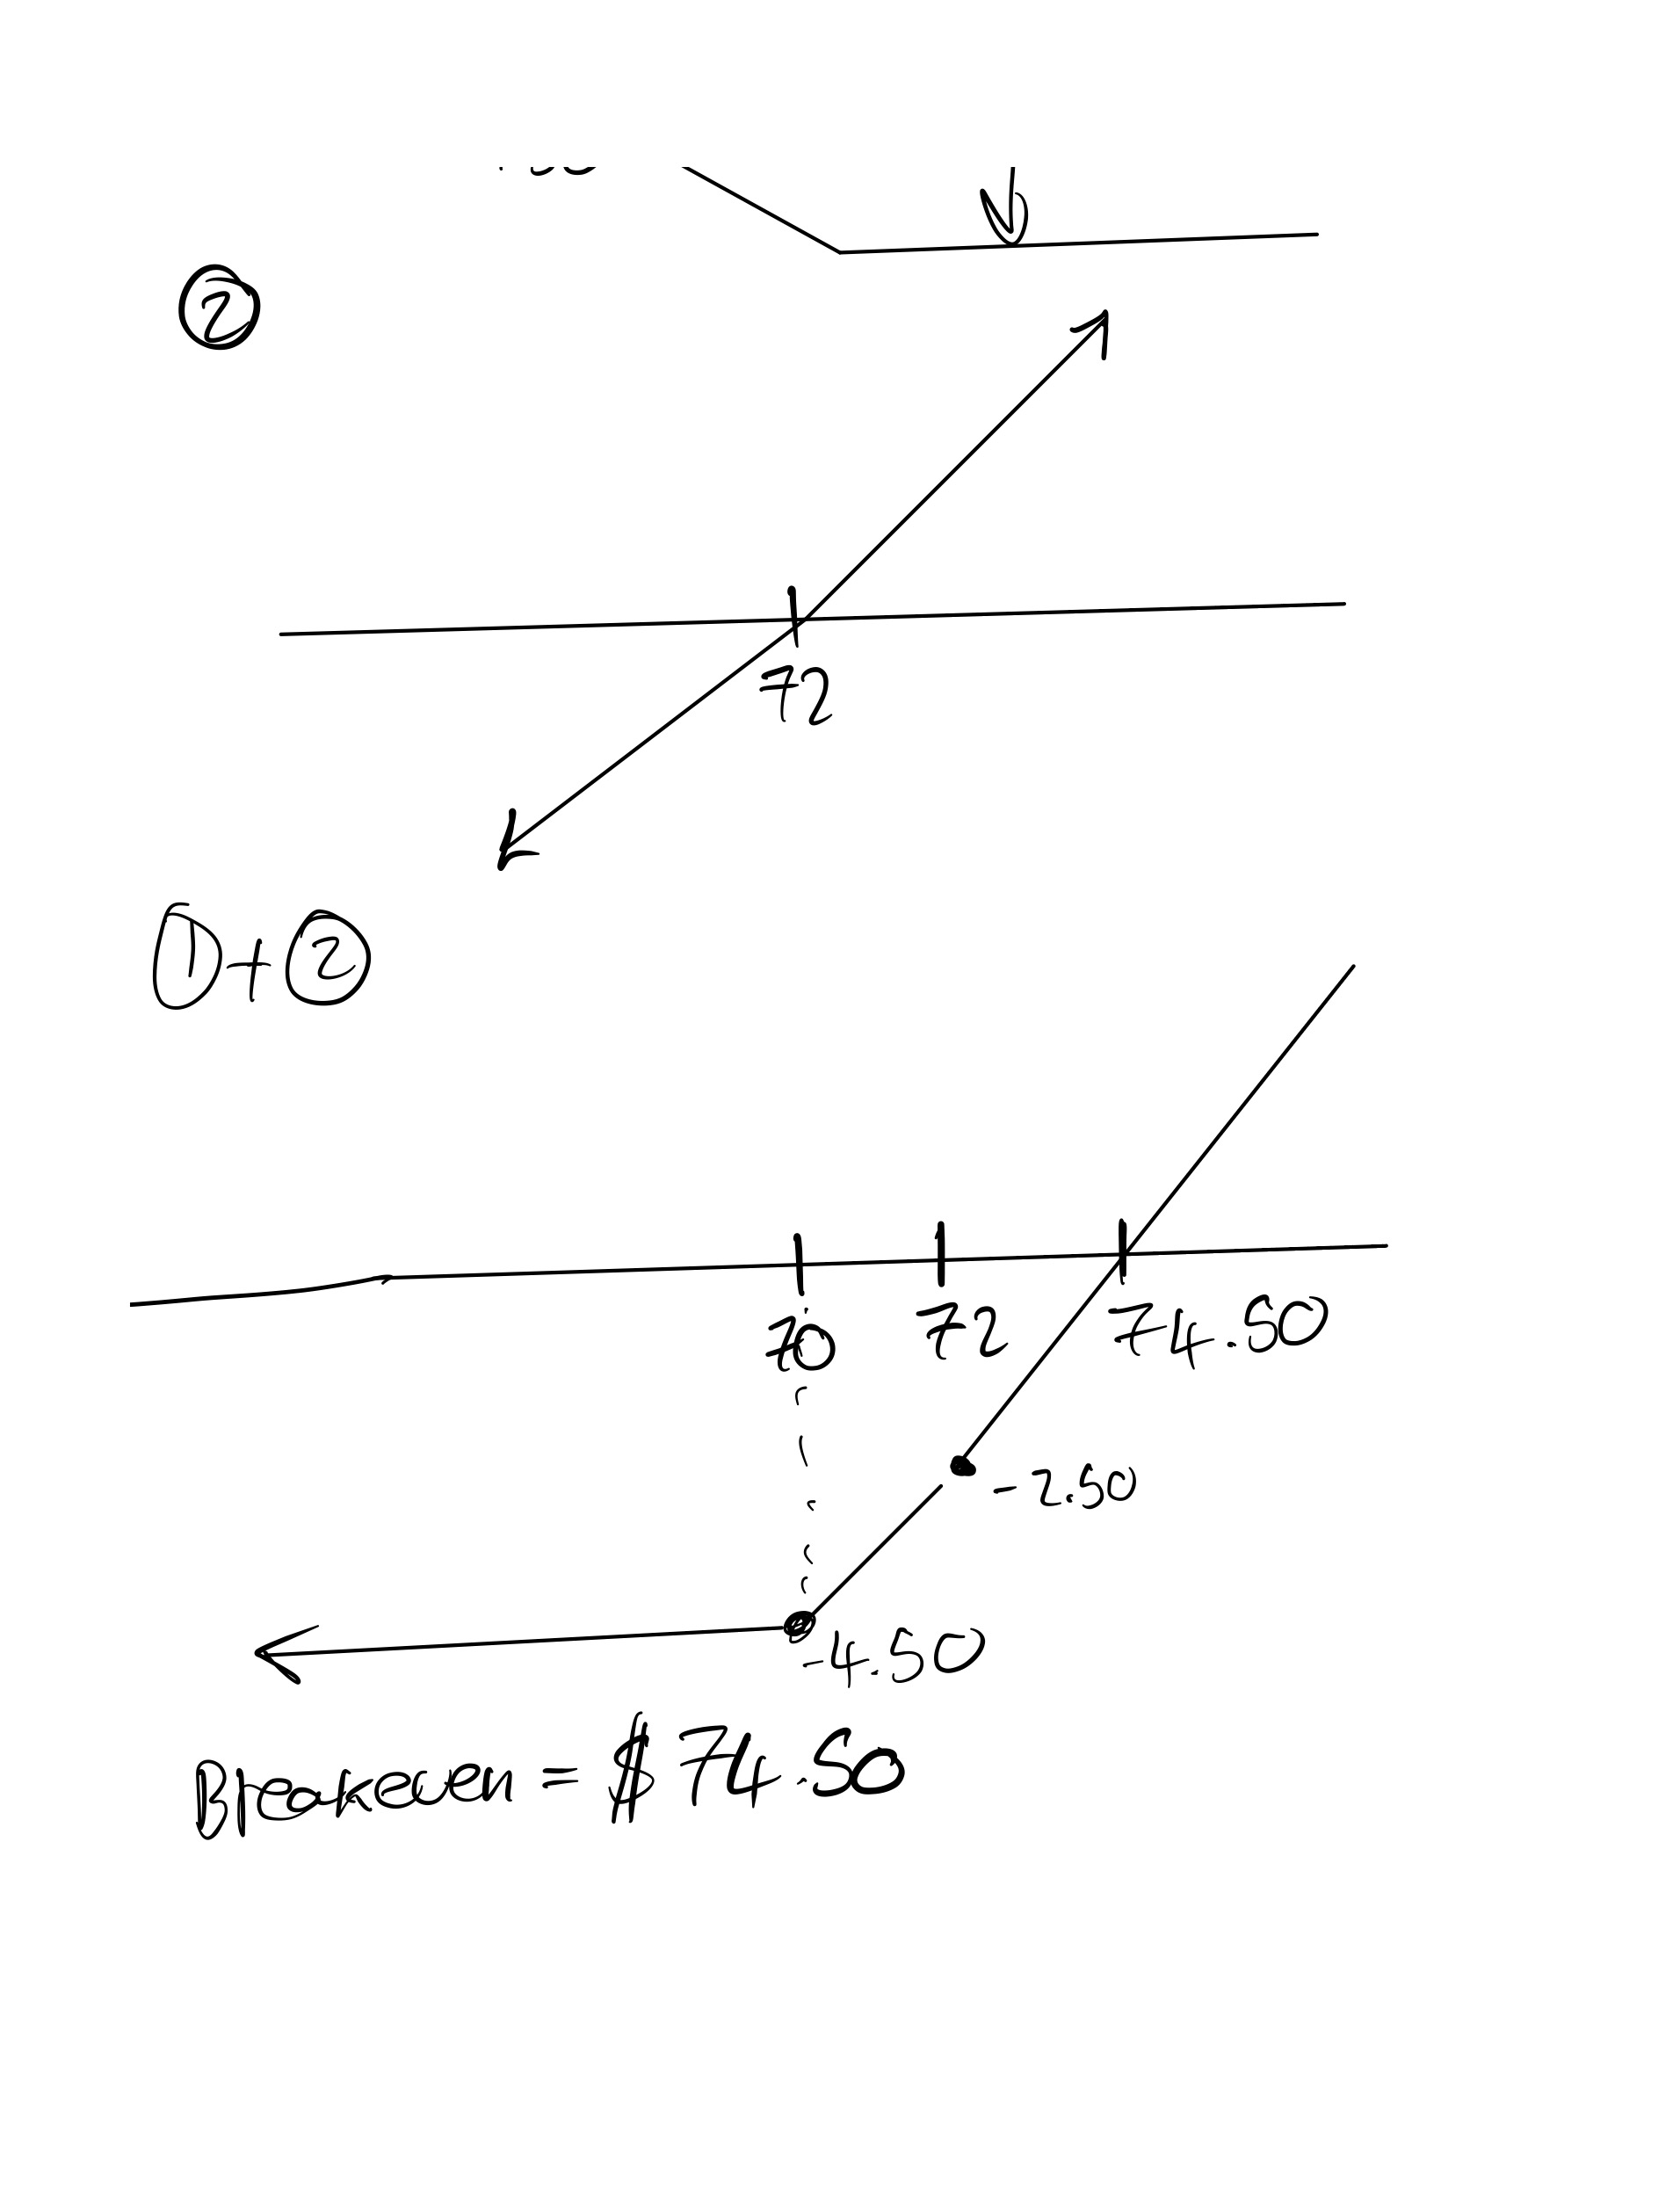
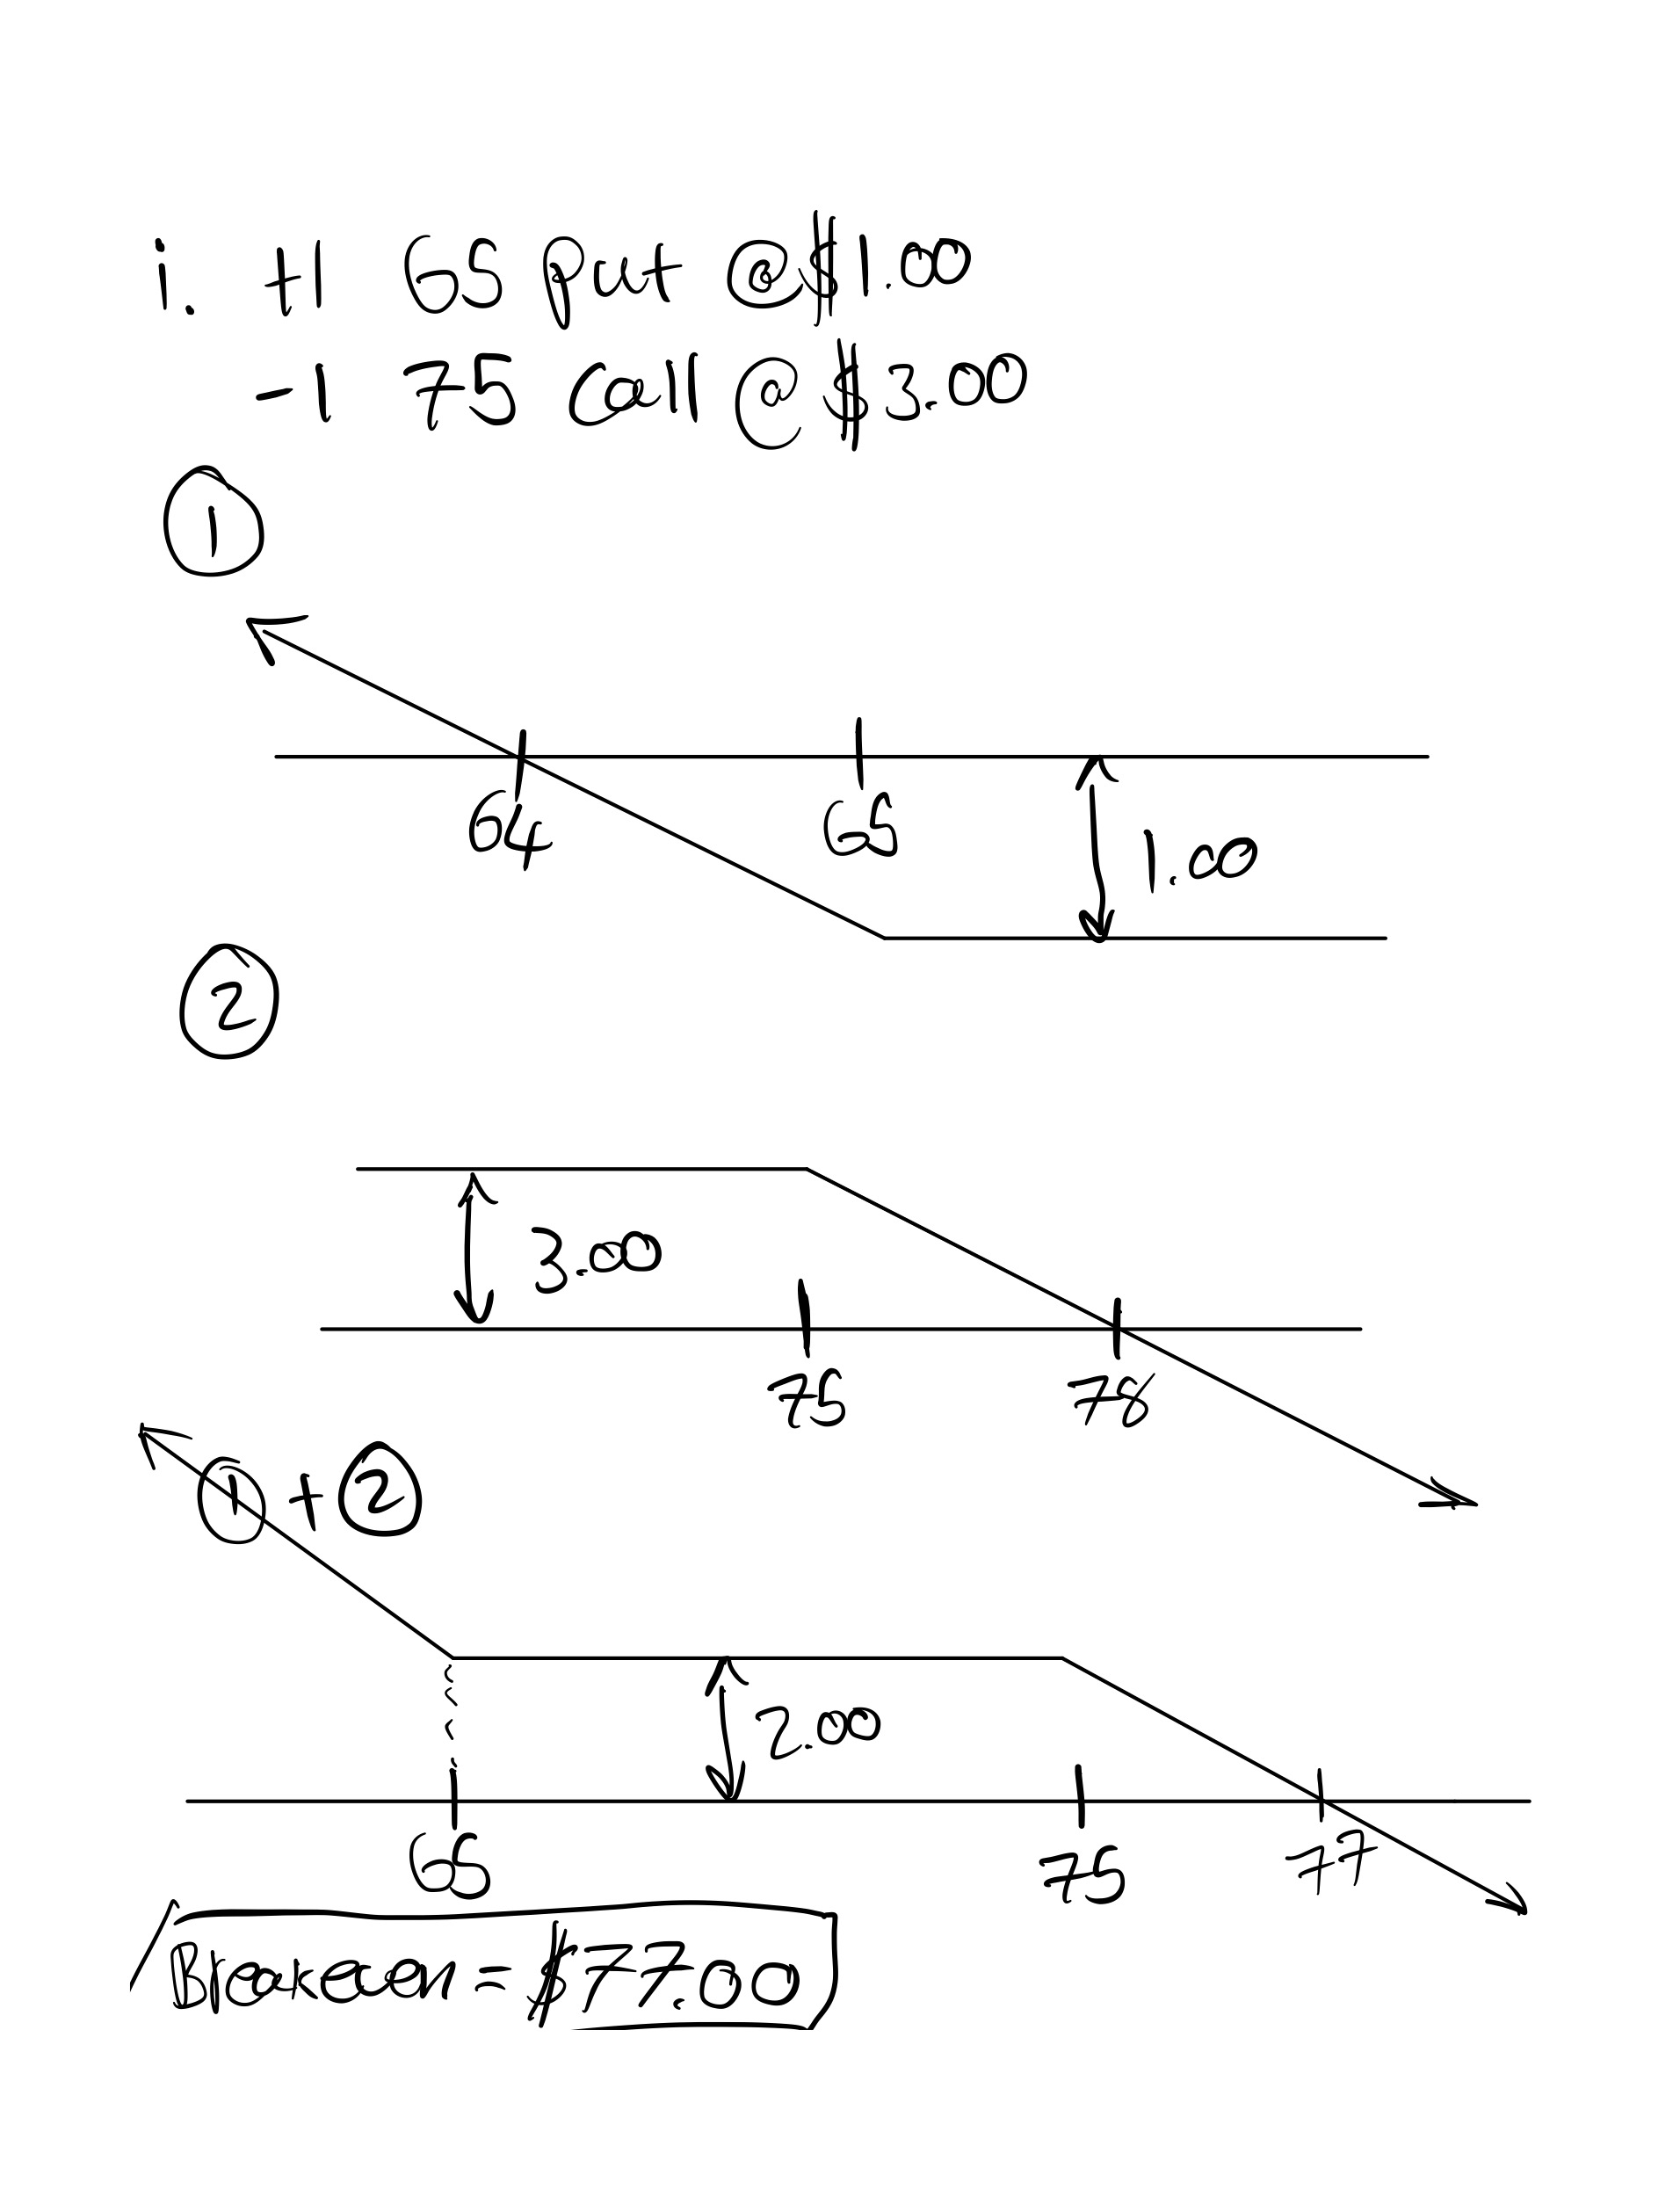
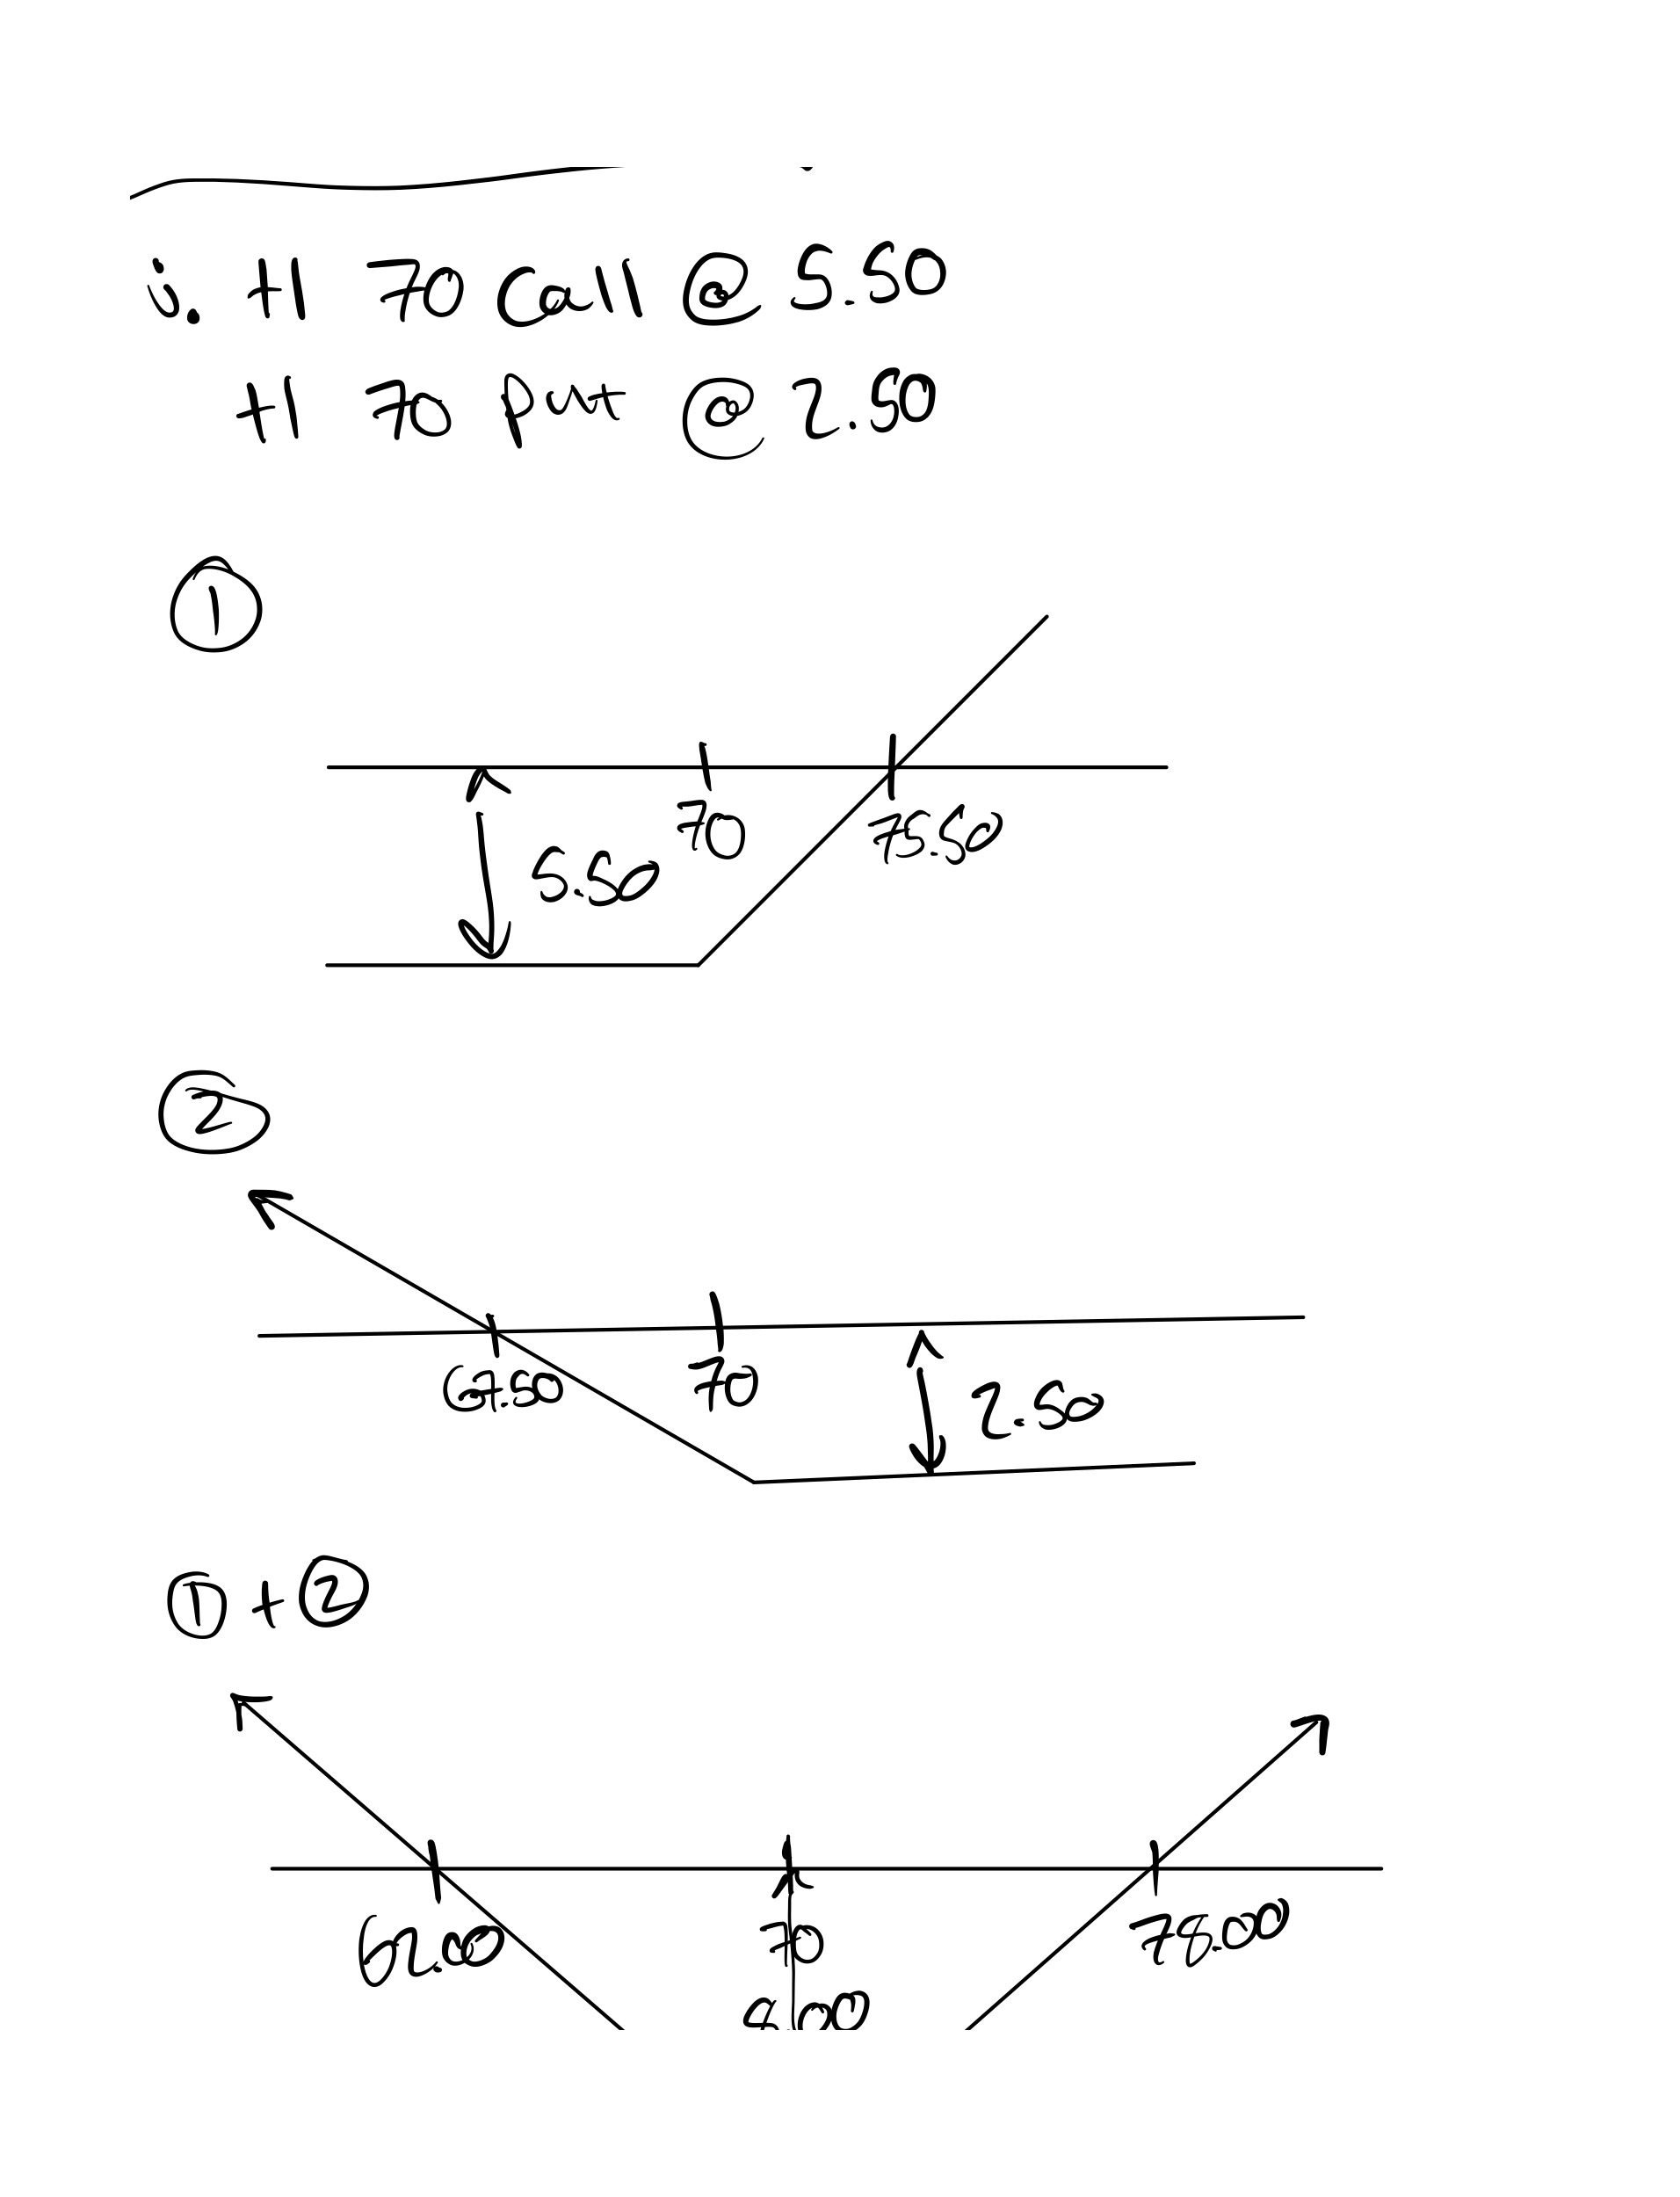
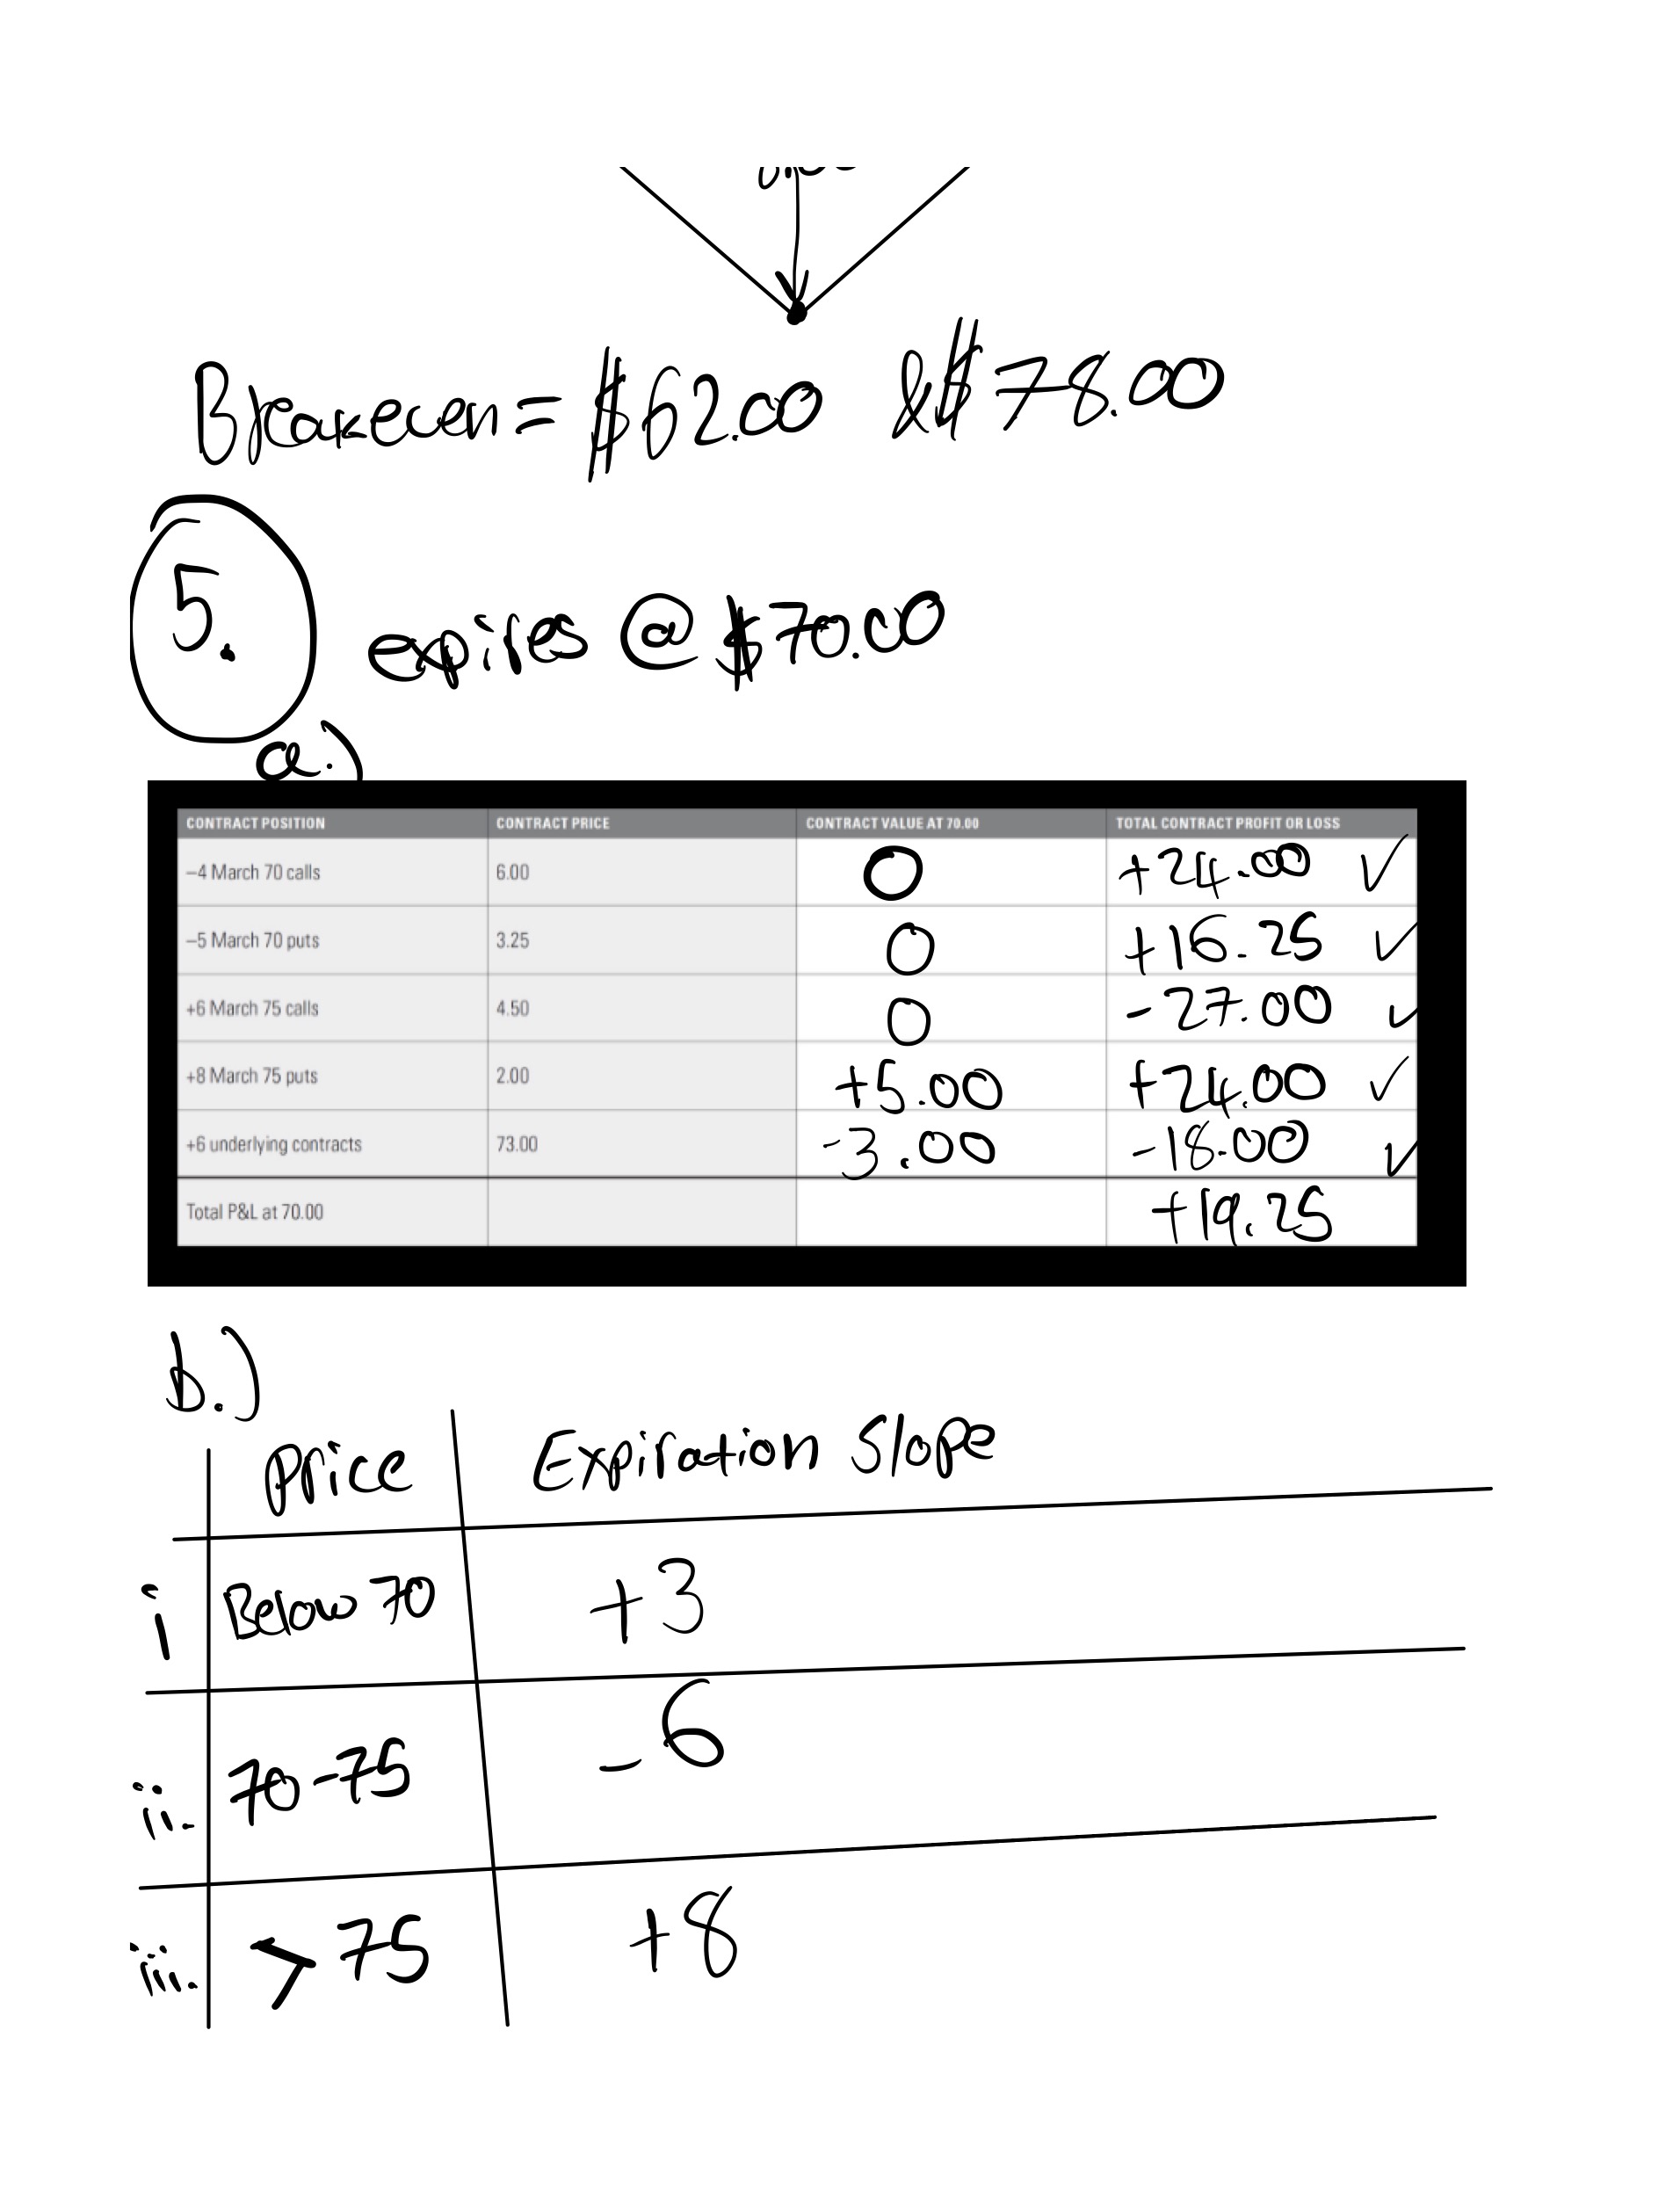
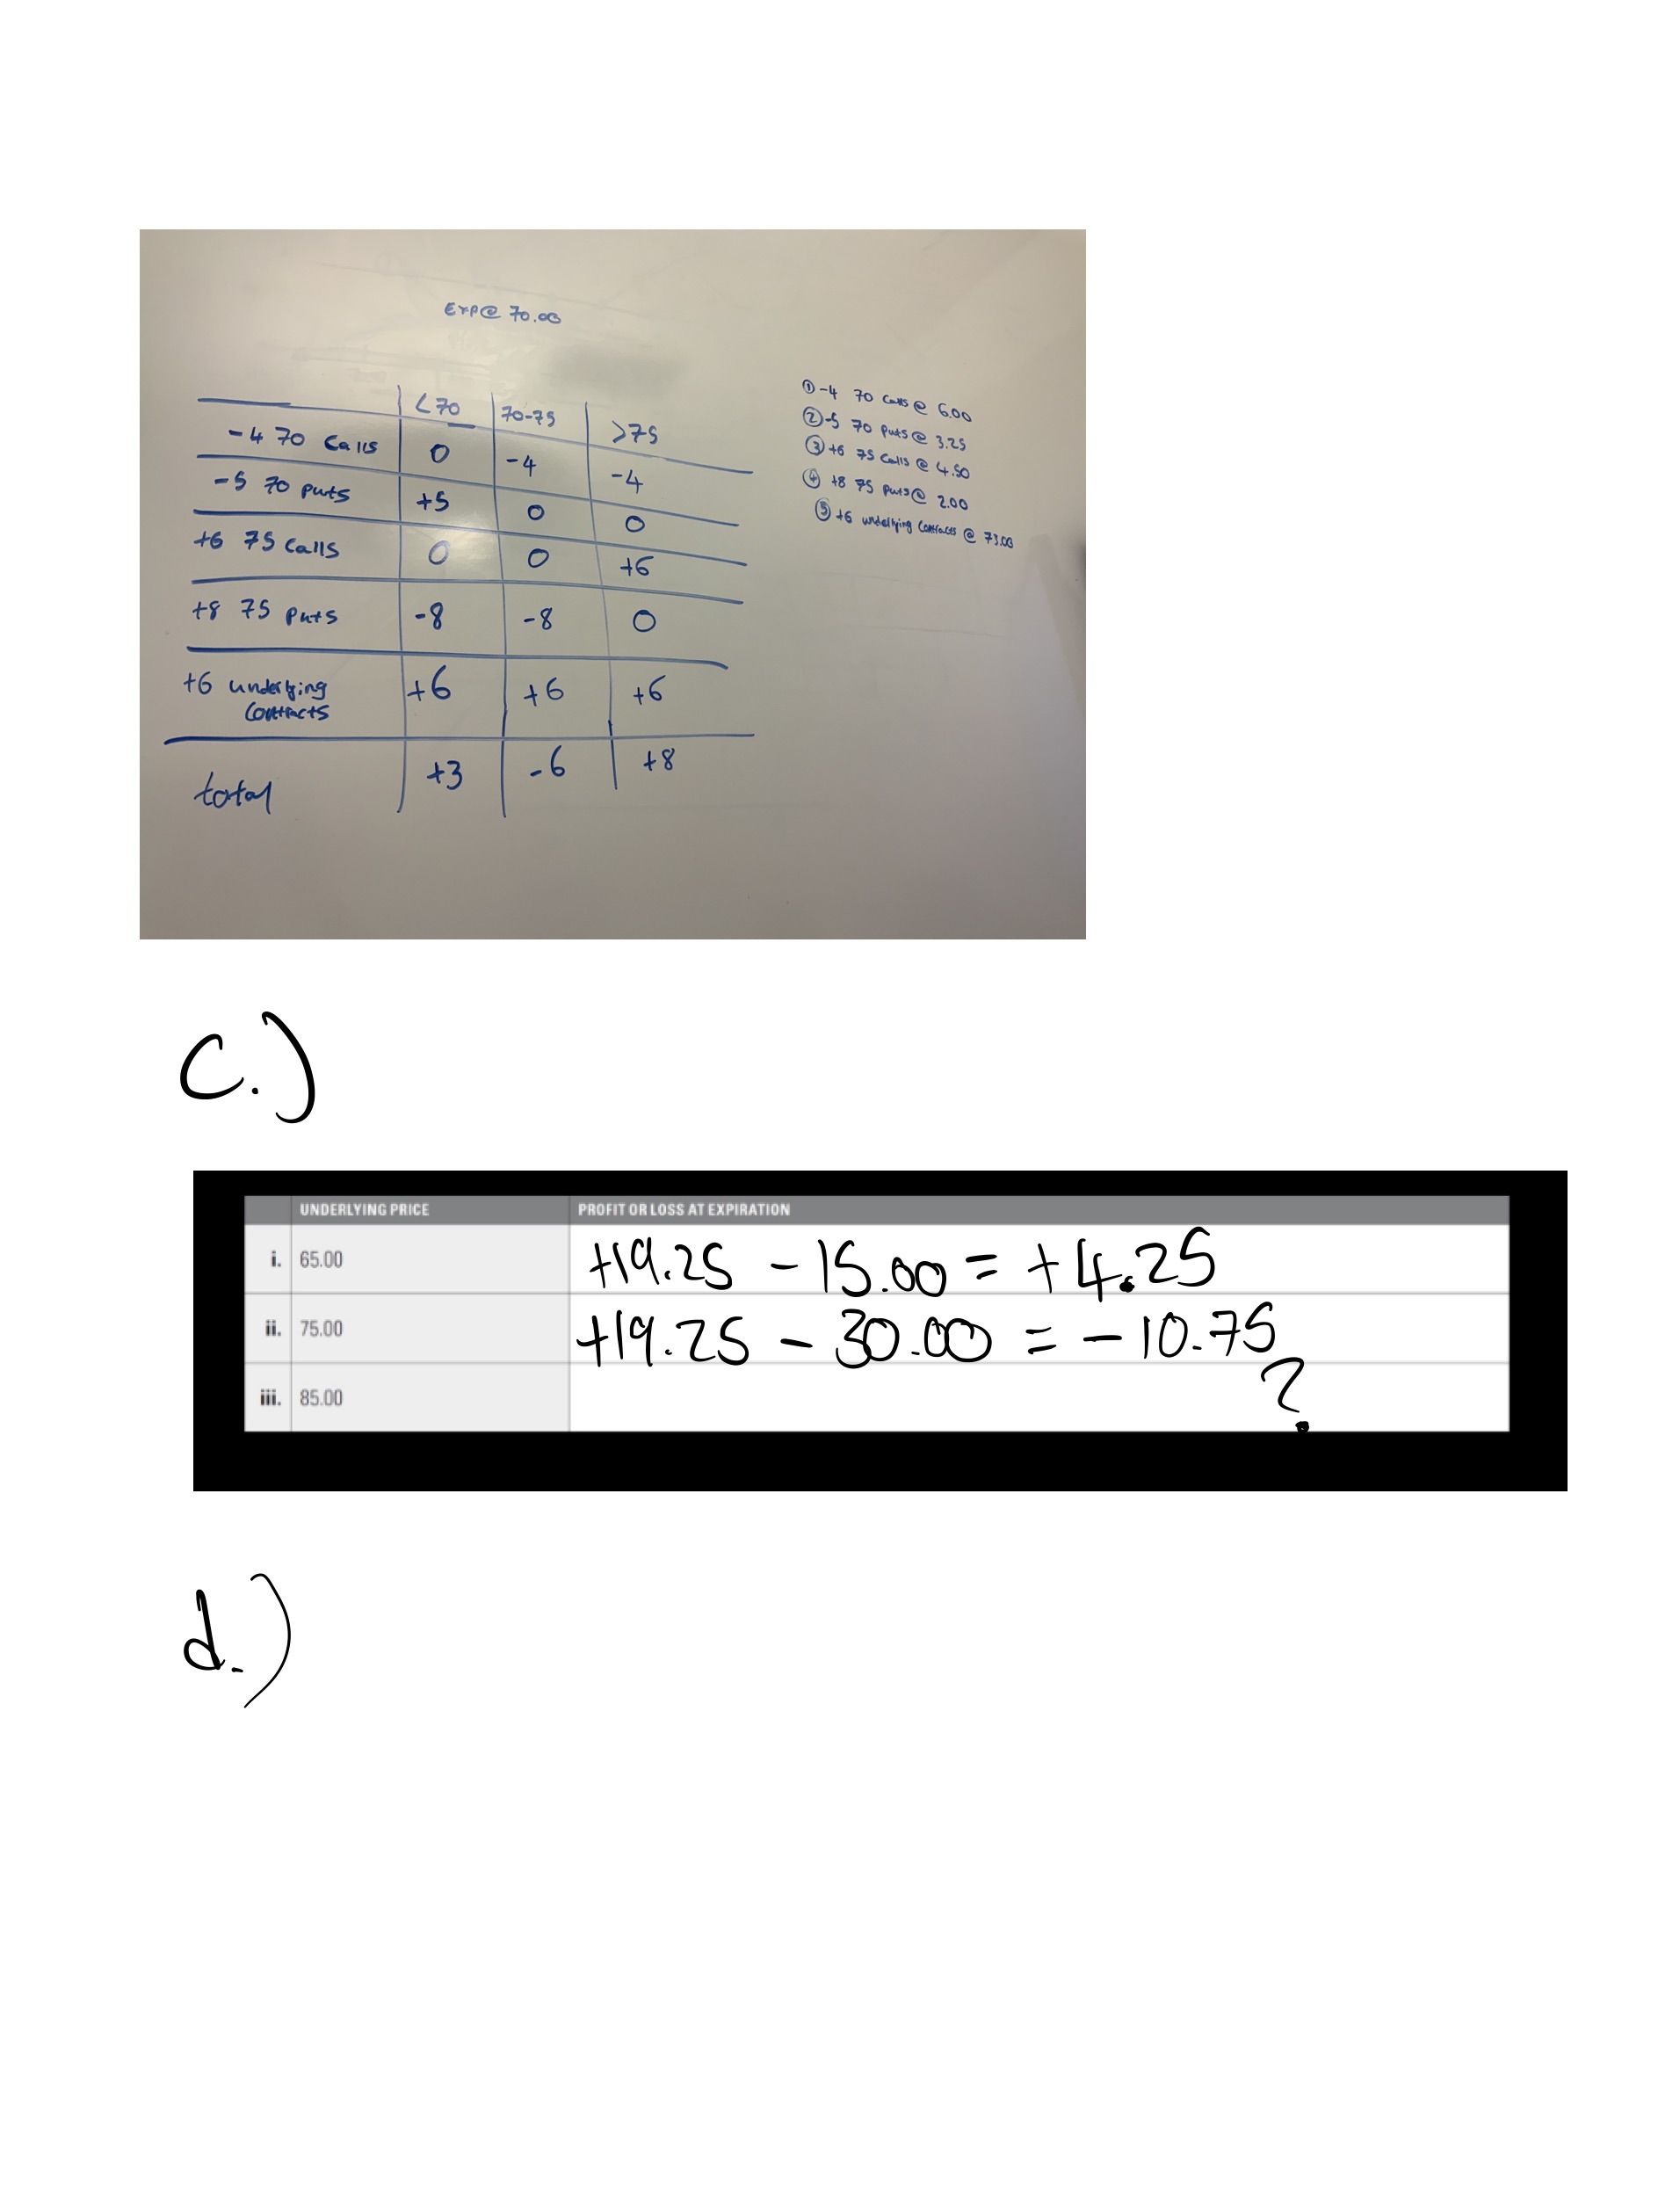
4. Using the underlying price and option prices below, draw the expiration profit and loss graph for the given
positions. What are the breakeven prices for each position?
Underlying price = 72.00
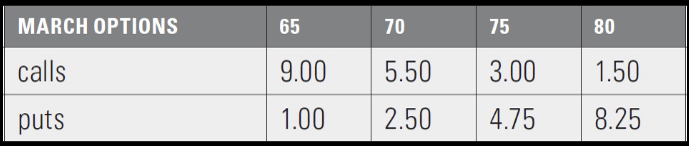
a. long a March 70 call
b. short a March 65 put
c. long a March 75 put
d. short a March 80 call
e. long a March 70 call and short a March 80 call
f. long a March 80 put and short 2 March 70 puts
g. short a March 70 call and long a March 70 put
h. long a March 70 put and long an underlying contract
i. long a March 65 put and short a March 75 call
j long a March 70 call and long a March 70 put